Figure 4.
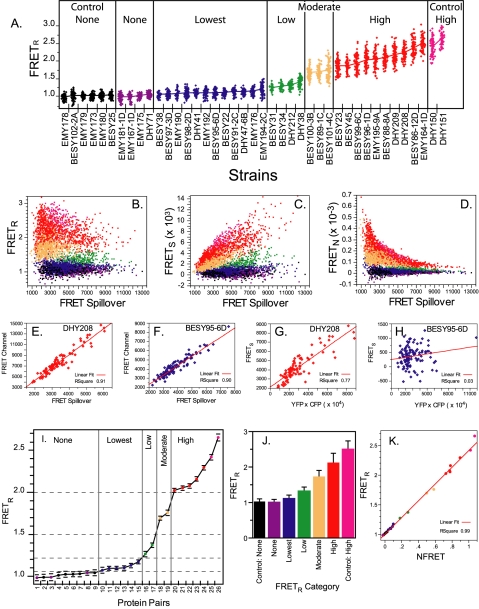
The measurement of FRET. (A) The different combinations of tagged core SPB proteins produced a full range of experimental FRETR values. Each point represents the FRETR value of an individual SPB. On average 80 SPBs were examined for each strain. The YFP/CFP combinations in each strain are described in Table 1. The means are connected. The color coding for the different categories is kept throughout the figure and in Figure 6, A, D, and E. (B–D) FRETR is independent of the extent of spillover in contrast to other FRET metrics. FRETR was compared with FRETS and FRETN. FRETS equals the FRETchannel – SpilloverTotal. FRETN equals FRETS ÷ (CFPchannel × YFPchannel) (Gordon et al., 1998). The same dataset of 3401 color-coded SPBs was used to compute FRETR FRETS, and FRETN. (B) In each category FRETR is independent of spillover as seen by the even response as spillover increased. (C and D) For FRETS and FRETN bias was apparent. As spillover increased FRETS increased and FRETN was suppressed. (E–H) FRETR response is linear. FRETR is equal to the slope of the lines in E and F. FRETN is equal to the slope of the lines in G and H. (I) Protein combinations were grouped into five FRETR categories. Plotted are the means and standard deviations. The numbers indicating the protein pairs correspond to the row numbers in Table 2. (J) The combined group means of the FRETR categories show clear differences. Bars correspond to the SD. Tukey-Kramer test classified the experimental categories statistically different at an alpha greater than 10–6. (K) The linear relationship between FRETR and NFRET. NFRET = FRETS÷ (CFPchannel × YFPchannel)1/2 (Xia and Liu, 2001). The mean FRET values for the protein pairs in I were calculated using both metrics from the same dataset of 3401 SPBs and also color coded as in I.

