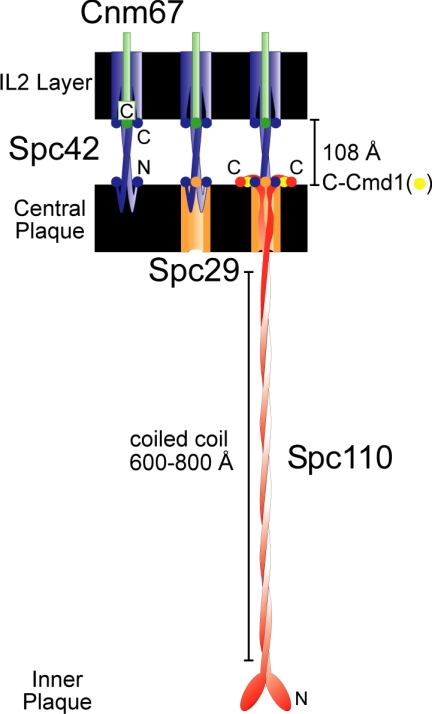
Figure 5.
Schematic edge-on view of SPB core proteins showing the course of the proteins through the central plaque and IL2 layers. The distance and depth of the layers as seen in cryo-electronmicrographs are shown. The circles represent the termini, and the twists represent regions of coiled coils. Spc42 is shown in blue, Cnm67 in green, Spc29 in orange, Cmd1 in yellow, and Spc110 in red.

