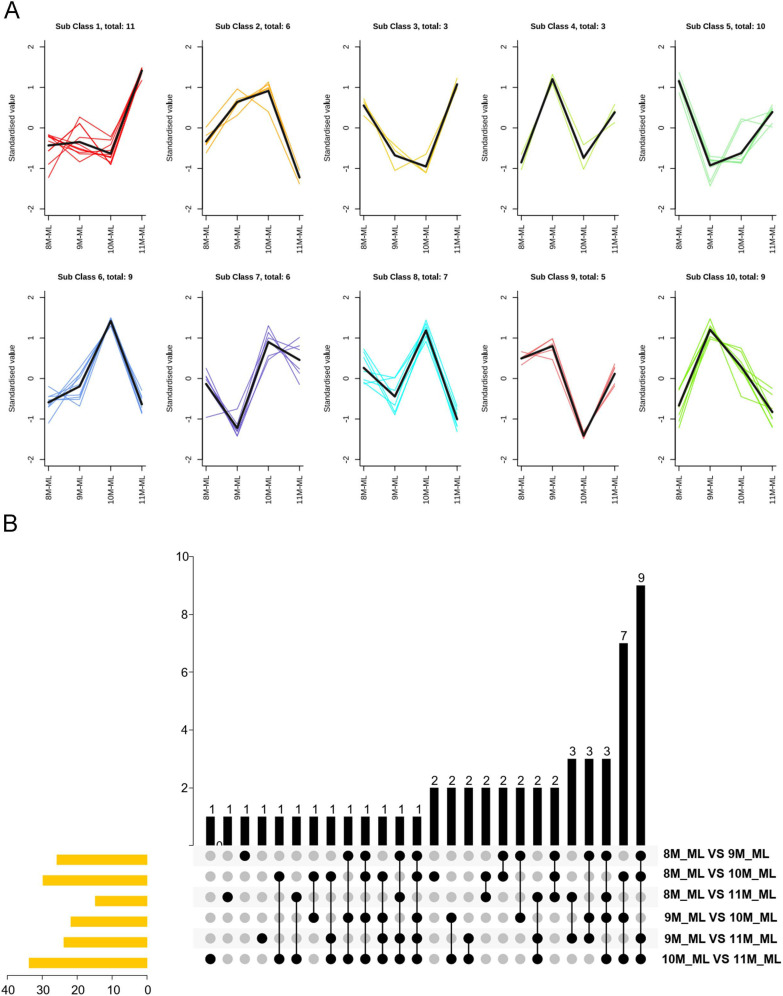
Fig. 2.
K-means Clustering and Upset Plot Analysis of Differential Terpenoid Metabolites. A: K-means clustering analysis of differential terpenoid metabolites. The sub-classes represent groups of metabolites with similar change trends across the sampling months. The x-axis shows the sample groups, and the y-axis represents the standardized relative content of terpenoid differential metabolites. B: Upset plot and bar diagram illustrating the intersection and unique elements of differential terpenoid metabolites between sample groups. The upper portion shows the unique and common metabolites across different groups, while the lower part visualizes the intersection classification with connecting lines indicating shared elements. The bar chart on the left shows the number of unique metabolites in each group

