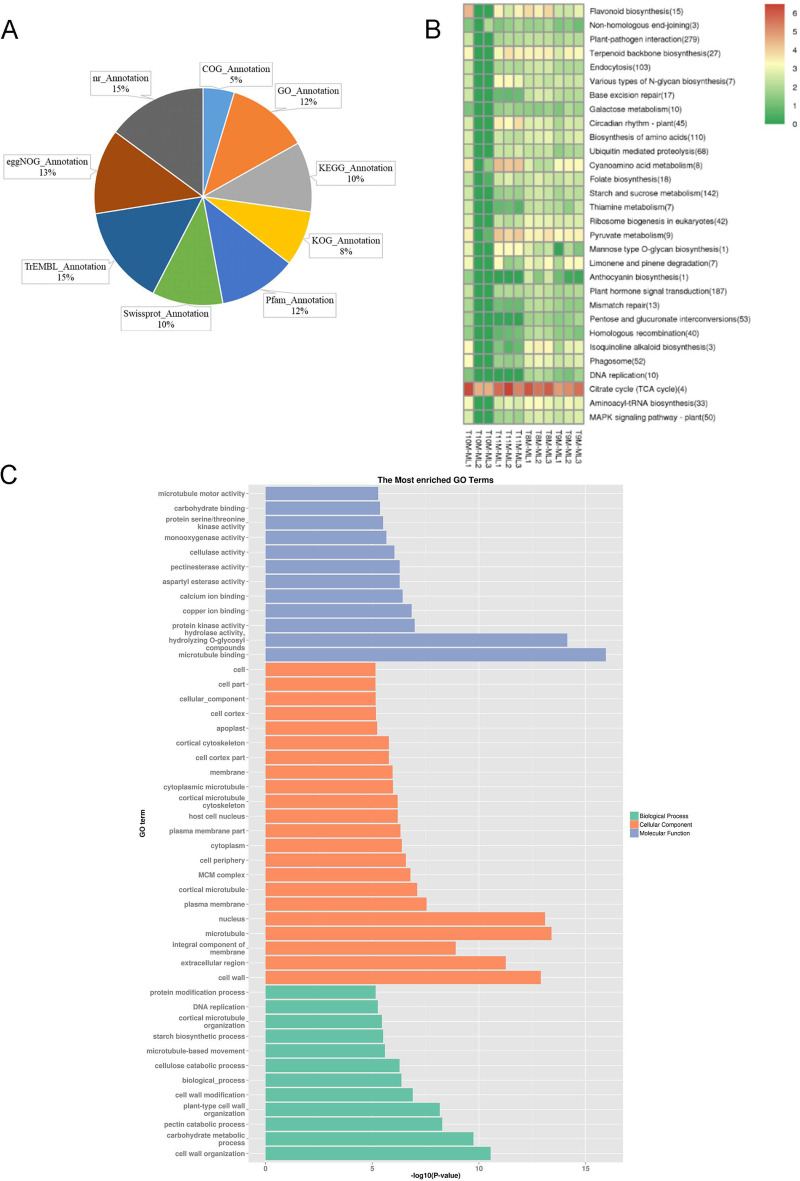
Fig. 3.
Gene Annotation and KEGG/GO Enrichment Analysis of DEGs. A: Pie chart representing the proportion of transcriptome gene annotations across nine databases, including GO, KEGG, SwissProt, Pfam, and others. B: KEGG enrichment clustering of DEGs. The color gradient from red to green indicates the relative expression levels, with red representing higher expression and green representing lower expression. The number in parentheses next to each term indicates the number of significantly different genes associated with that pathway. C: GO enrichment analysis of DEGs, categorized by biological process, cellular component, and molecular function. The x-axis represents the logarithm of the enrichment significance (-log10 p-value), and the y-axis lists the corresponding GO terms

