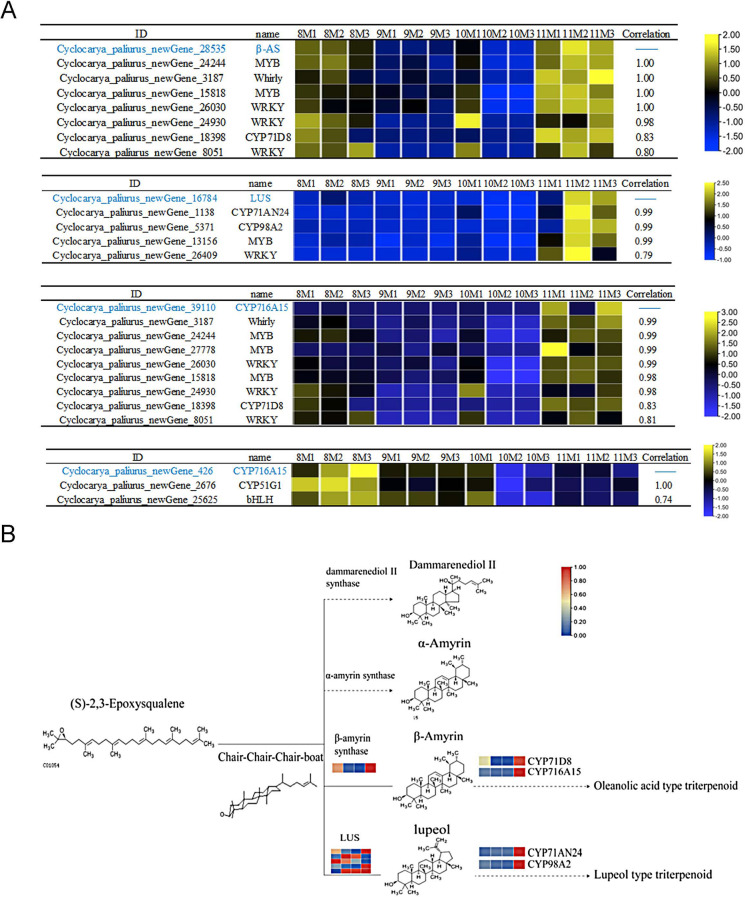
Fig. 5.
P450 Enzymes and Transcription Factors Correlated with β-AS,LUS, and CYP716A15 in the Downstream Triterpenoid Synthesis Pathway in C. paliurus. A: Heatmap showing the expression profiles (FPKM values) of P450 enzymes and transcription factors that exhibit high correlation (Pearson > 0.7) with key functional genes in triterpenoid biosynthesis, including β-AS,LUS, and CYP716A15. The left panel lists the gene IDs and corresponding gene names, while the heatmap in the middle presents the normalized gene expression levels across different months. The right panel highlights highly correlated P450 enzymes and transcription factors. B: Schematic representation of the downstream pathway of triterpenoid synthesis. Solid lines indicate steps where differential genes have been identified in the transcriptome, while dashed lines represent potential unknown steps or genes not yet identified. The colored blocks represent FPKM values for differentially expressed genes (DEGs) from August to November, with the color gradient indicating changes in expression levels

