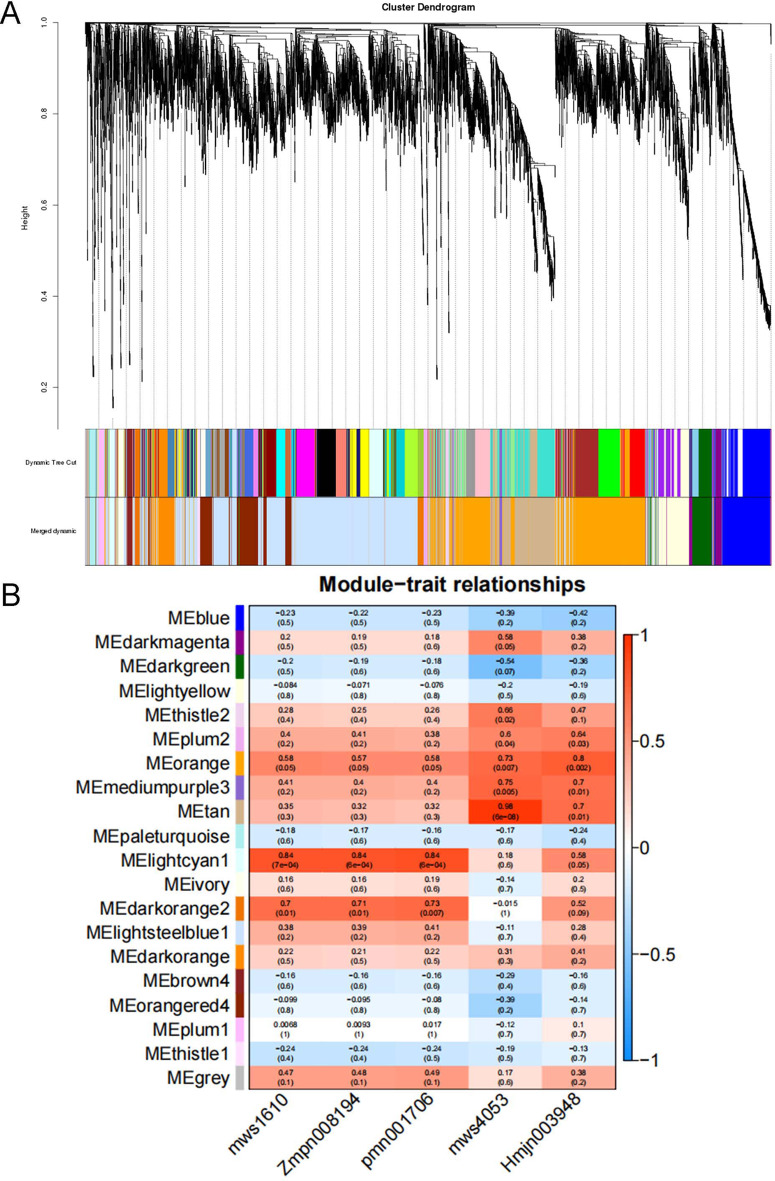
Fig. 6.
Gene Clustering Tree and Heatmap of Correlations with Triterpenoid Metabolites. A: Gene clustering tree showing module division. Different branches represent clusters of co-expressed genes, with each module marked by a distinct color. B: Heatmap representing the correlation between gene modules and the relative content of triterpenoid metabolites. The color gradient represents the correlation values, with red indicating positive correlations and blue indicating negative correlations between gene expression modules and triterpenoid metabolite levels

