Figure 5.
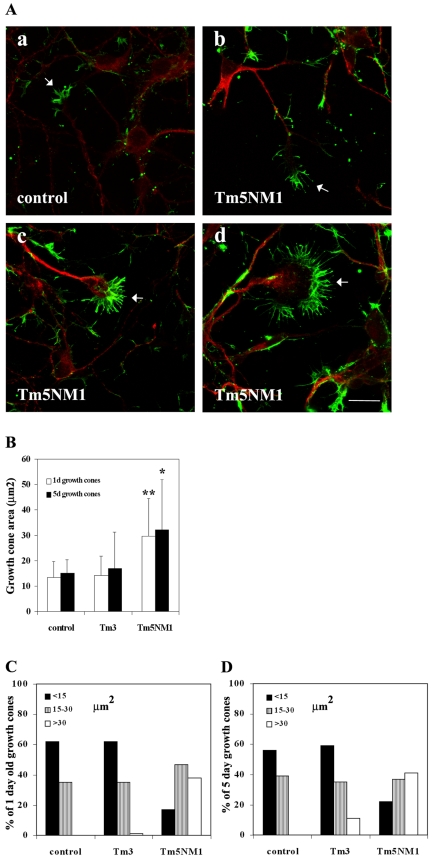
Overexpression of Tm5NM1 results in enlarged growth cones. (A) Primary cortical neurons were cultured for 5 d and double immunofluorescence stained with the WS5/9d (red) antibody and β-actin (green). The merged images are depicted. Control neurons (a) and Tm5NM1 neurons (c, d, and e). Note the enlarged growth cones (arrows) and long filopodia in the Tm5NM1 neurons. Bar, 20 μm. (B) The surface areas of 1- and 5-d-old growth cones were determined by using Image-Pro Plus version 4.0 of neurons stained with a total actin antibody, C4. An average of 50 growth cones from each group was selected from a number of chamber slides from two independent cultures. A nonparametric ANOVA test was chosen because the data did not display a Gaussian distribution. Asterisks indicate *p < 0.001 and **p < 0.005. The data also were plotted as a percentage of neurons with a particular range of growth cone size for the 1- (C) and the 5 (D)-d-old neurons.

