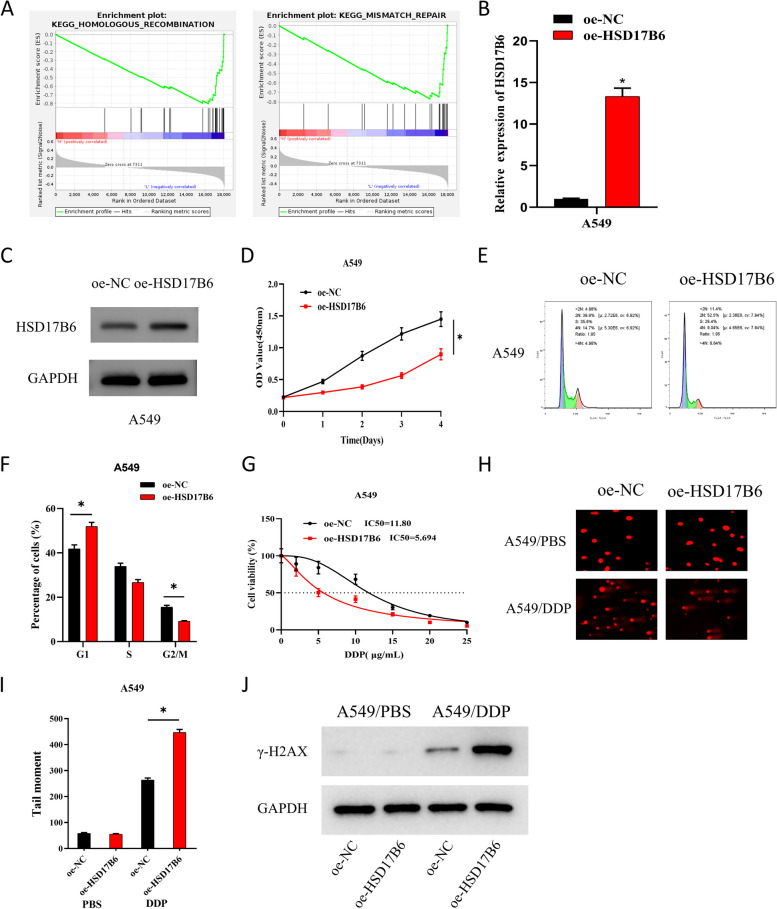
Fig. 2.
HSD17B6 inhibits LUAD cisplatin resistance via DNA damage. A GSEA pathway enrichment analysis of HSD17B6; B, C qPCR and WB analysis of expression levels of HSD17B6 in different treatment groups. D CCK-8 was used to detect the cell viability of different treatment groups. The x-axis represents the incubation days of cells with reagents, and the y-axis represents the OD values. E, F FCM was used to detect the number of cells in G1, S and G2/M phases. The x-axis represents DNA content, where 2N (DNA content doubles, typically corresponding to G1 and G2 phases) and 4N (DNA content quadruples, typically corresponding to G2 and M phases) indicate different cell cycle stages, and the y-axis represents the count of viable cells; G CCK-8 was used to detect the IC50 values of the two groups of cells treated with gradient concentrations of cisplatin. H, I:Comet assay was used to detect DNA damage in the two groups of cells treated with PBS and semi-inhibitory concentration cisplatin. J WB was used to detect the expression of DNA damage-related proteins γ-H2AX in cells from different treatment groups. * means P < 0.05

