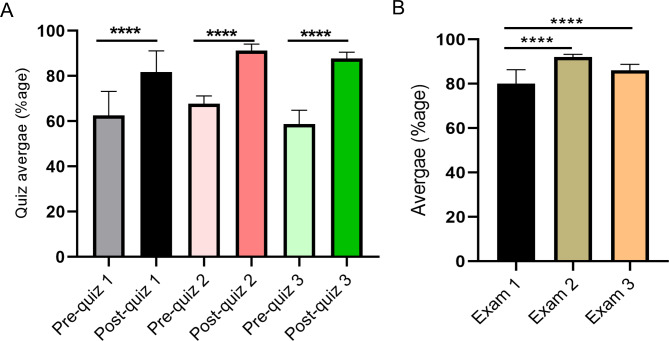
Fig. 2.
Student performance on the ultrasound quizzes and summative exams. (A) Student average performance on the pre- and post-ultrasound quizzes (3 pre- and 3 post-quizzes) over the years was shown as a bar graph. (B) Student performance on static ultrasound image interpretation questions on summative exams was shown as a bar graph. Data are expressed as the mean ± standard deviation. A one-way Analysis of Variance (ANOVA) followed by Tukey’s post-hoc test was performed using GraphPad Prism software. A p ≤ 0.05 was considered significant (**** p < 0.0001)

