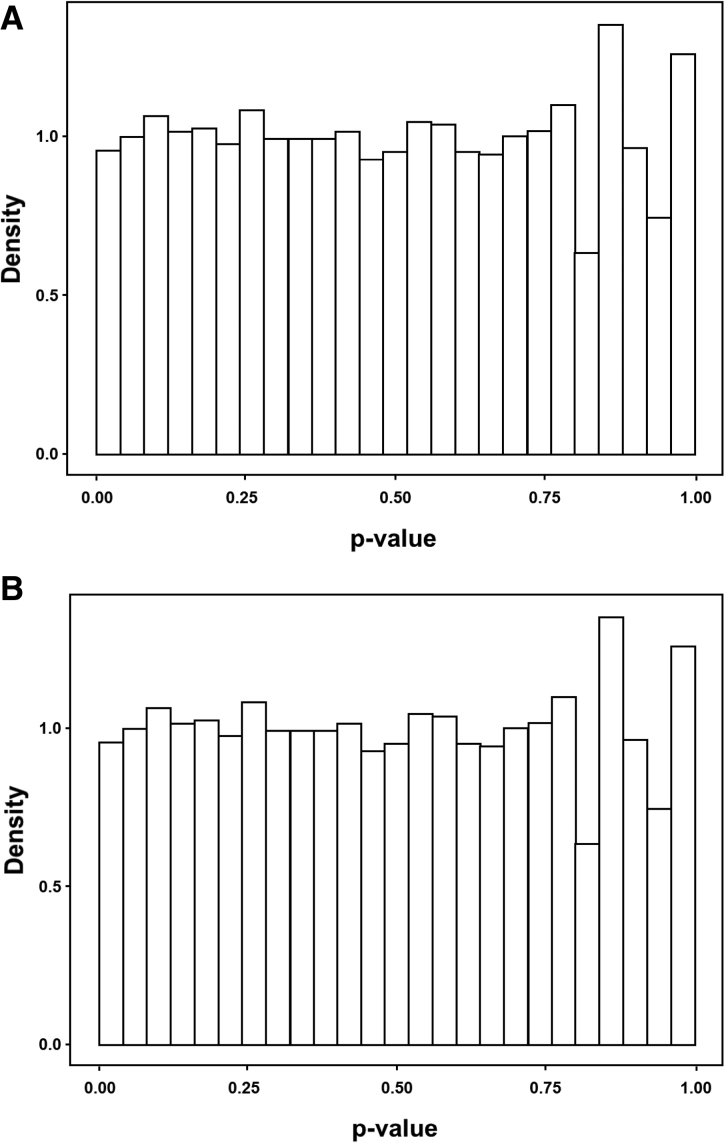
Figure 2.
Distribution of P values. Genome-wide association was studied by examining the distribution of P values as proposed by Storey and Tibshirani.32 A, Distribution of P values in unadjusted data. B, Distribution of P values in data adjusted for sex. Overall, no evidence was found to reject the null hypothesis of no genome-wide association with blood pressure response to renal denervation.

