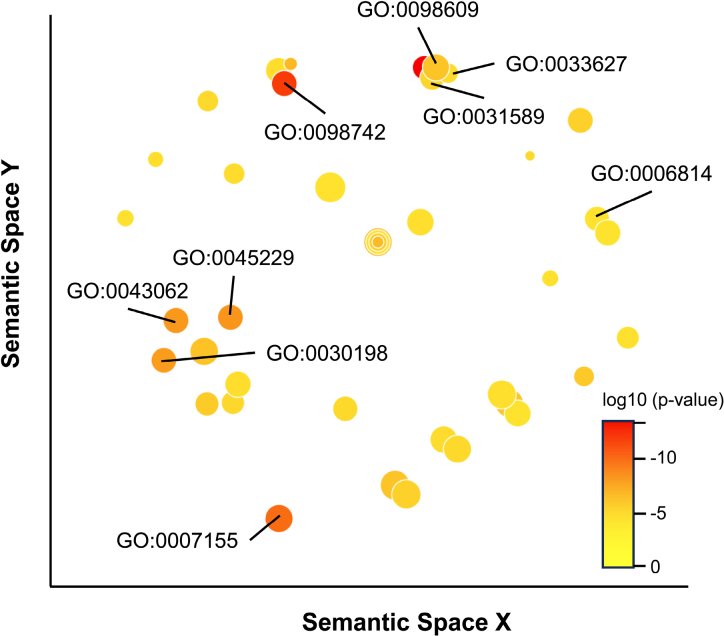
Figure 3.
Gene ontology analysis of differentially regulated biologic processes. The figure illustrates gene ontologies (GOs) and their relationships within semantic spaces. Three key processes are labeled: cell adhesion (GO:0007155, cell adhesion; GO:0031589, cell-substrate adhesion; GO:0098609, cell-cell adhesion; GO:0098742, cell-cell adhesion via plasma-membrane adhesion molecules; GO:0033627, cell adhesion mediated by integrin), sodium transport (GO:0006814, sodium ion transport), and extracellular matrix (GO:0030198, extracellular matrix organization; GO:0043062, extracellular structure organization; GO:0045229, extracellular encapsulating structure organization). Detailed data are provided in Table S2. P values are illustrated by bubble color. Bubble size represents LogSize (ie, log10 number of annotations for GO term identifier). Analysis was conducted using the GO Enrichment Analysis tool (https://geneontology.org/) with standard settings. Enrichment analysis and graphical output were conducted with REVIGO (http://revigo.irb.hr/) using H. sapiens reference data. The x and y axis units were removed as they are arbitrary and nonlinear in REVIGO.

