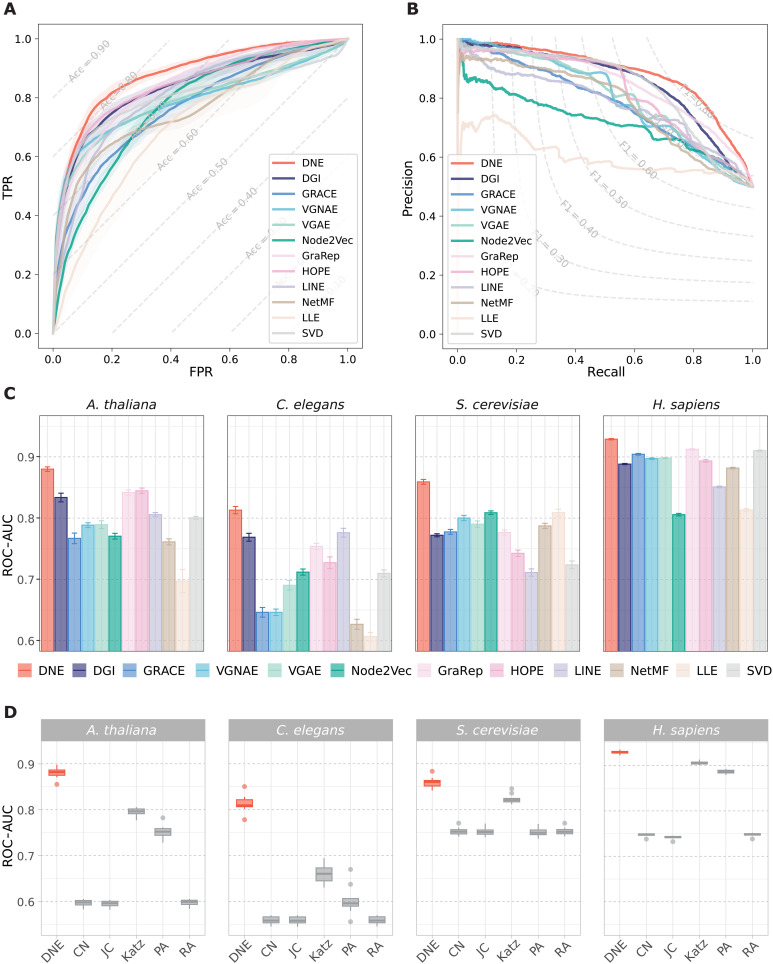
Fig. 2. Performance of different methods for link prediction across four PPI benchmarks.
(A) ROC and (B) PR curves of DNE compared with 11 other network embedding methods for PPI prediction on the A. thaliana dataset. Dashed lines represent level curves for accuracy and F1 score in (A) and (B), respectively. (C) Comparison of DNE with network embedding methods in four PPI benchmarks, presenting mean and SDs of ROC-AUC scores from 10 independent runs. (D) Comparison of DNE with similarity-based link prediction methods in four PPI benchmarks, presenting ROC-AUC scores from 10 runs. The central line within the box denotes the mean, the box edges represent the first and third quartiles, and the whiskers extend to ±1.5 times the interquartile range.

