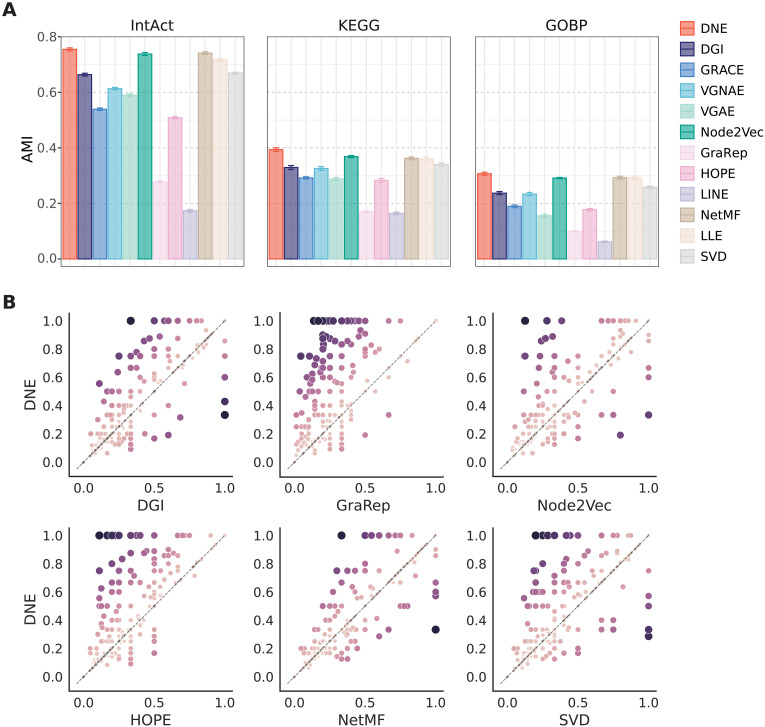
Fig. 3. Performance of different network embedding methods for module identification.
(A) AMI scores computed from 10 independent runs by using annotated complexes from IntAct, KEGG, and GOBP as reference standards. Mean values are reported, and error bars represent the SDs of the scores. (B) Comparison of per-module Jaccard scores between DNE and six representative baselines. Each point represents a protein complex. The x axis and y axis represent the per-module overlap (Jaccard) scores obtained by the specified baseline method and DNE, respectively. A score of 0 indicates that no members in the complex were captured, and 1 indicates that all members in the complex were captured. The color and size of each point indicate the difference in Jaccard scores between DNE and other baseline methods for the corresponding complex.

