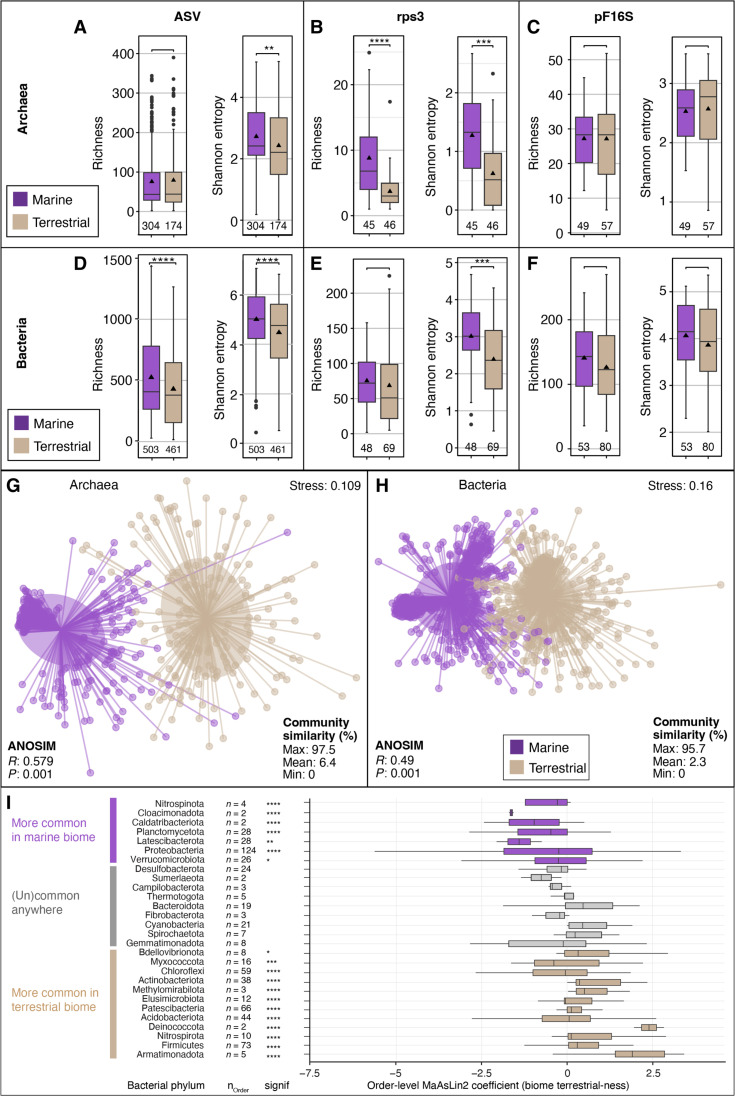
Fig. 2. Microbial diversity in marine and terrestrial biome.
Archaeal (A to C) and bacterial (D to F) alpha diversity (per sample community richness and evenness) in marine and terrestrial biomes using 16S rRNA gene ASVs [(A) and (D)], as well as metagenome-derived ribosomal protein S3 genes [rpS3; (B) and (E)] and 16S rRNA gene sequences detected by phyloFlash (pF16S). To allow comparison, the datasets were subsampled to the same number of reads. Pairwise comparisons were performed using a Wilcoxon rank sum test. Significance: **P < 0.01, ***P < 0.001, ****P < 0.0001. The number of analyzed datasets is shown below the boxplots. Community dissimilarity between marine and terrestrial communities was shown by nonmetric multidimensional scaling ordinations of ASV-based dissimilarity matrices using 478 archaeal (G) and 964 bacterial datasets (H). Each dot represents the community structure of a dataset and is connected to the group centroid (weighted average mean of within-group distances); ellipses depict 1 SD of the centroid. Statistical testing using ANOSIM showed that the groups are overlapping but significantly different (R ∼ 0.5, P < 0.001). (I) Differential sequence abundance analyses of marine versus terrestrial bacterial phyla. The phyla are ordered from top to bottom based on increasing phylum level MaAsLin2 coefficient, i.e., likeliness of their occurrence in terrestrial-derived samples (“terrestrialness”). Boxplots summarize order level MaAsLin2 coefficients, i.e., terrestrialness, within the listed phyla. Note that due to ease of visualization, boxplots are also shown for very small number (n) of orders. Significance levels are: *P < 0.01, **P < 0.001, ***P < 0.0001, and ****P < 0.00001. Additional phyla, particularly those that lack cultured representatives, are shown in fig. S6.

