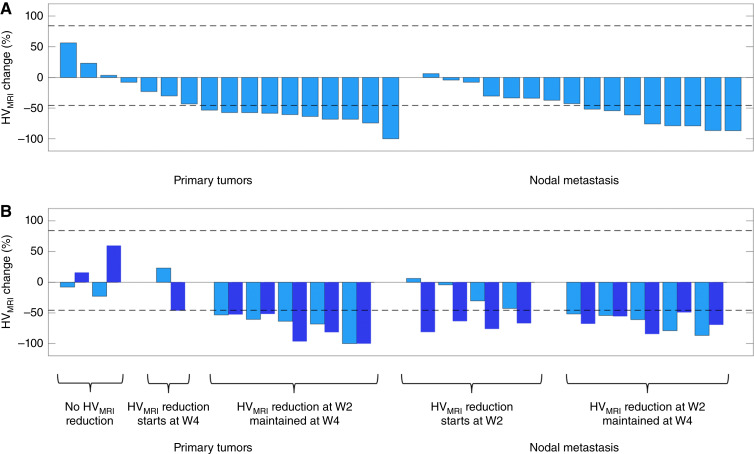
Figure 2.
HVMRI changes at W2. A, Waterfall plot showing the percentage change in HVMRI from BL to W2 in all lesions, categorized as primary tumors or nodal metastases. B, Analysis of the 17 lesions imaged at both W2 and W4 compares the reduction from BL at W2 (light blue) and W4 (dark blue). Dashed lines are the asymmetrical RC LOA for HVMRI (i.e., −45.7% and +84.1%).

