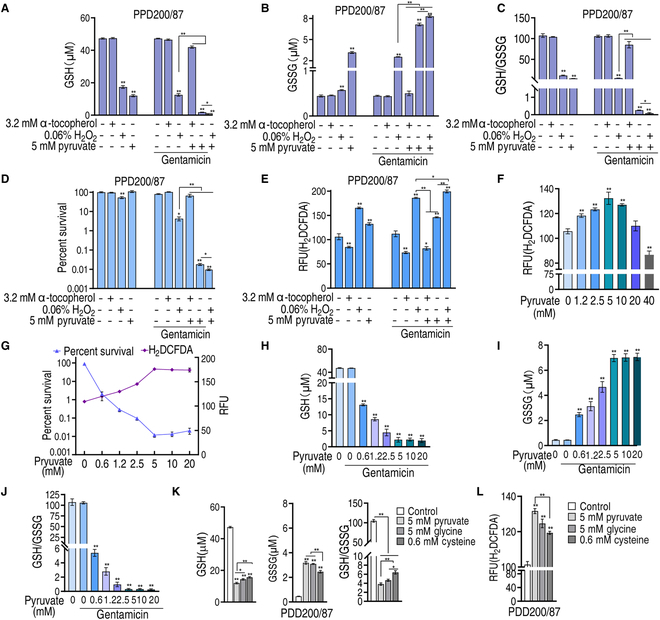
Fig. 4.

Redox modulated by exogenous pyruvate affects gentamicin killing. (A) GSH of PPD200/87 in the absence or presence of 5 mM pyruvate and/or 60 μg/ml gentamicin plus 3.2 mM α-tocopherol, or 0.06% H2O2. (B) GSSG of PPD200/87 in the absence or presence of 5 mM pyruvate and/or 60 μg/ml gentamicin plus 3.2 mM α-tocopherol, or 0.06% H2O2. (C) Ratio of GSH/GSSG in (A) and (B). (D) Survival of PPD200/87 (108 CFU/ml) in the presence of 60 μg/ml gentamicin and 5 mM pyruvate plus 3.2 mM α-tocopherol, or 0.06% H2O2. (E) ROS content in (D). (F) ROS of PPD200/87 in the indicated concentration of pyruvate. (G) Relationship between survival and ROS of PPD200/87 (107 CFU) in the presence of the indicated concentrations of pyruvate and 60 μg/ml gentamicin. (H) GSH of PPD200/87 in the indicated concentration of pyruvate and 60 μg/ml gentamicin. (I) GSSG of PPD200/87 in the indicated concentration of pyruvate and 60 μg/ml gentamicin. (J) GSH/GSSG in (H) and (I). (K) GSH, GSSG, and their ratio of PPD200/87 in the absence or presence of 5 mM pyruvate, 5 mM glycine, or 0.6 mM cysteine. (L) ROS of PPD200/87 (107 CFU) in the absence or presence of 5 mM pyruvate, 5 mM glycine, or 0.6 mM cysteine. Results are displayed as the mean ± SD, and statistically significant differences are identified by Kruskal–Wallis followed by Dunn’s multiple comparison post hoc test unless otherwise indicated. *P < 0.05 and **P < 0.01.
