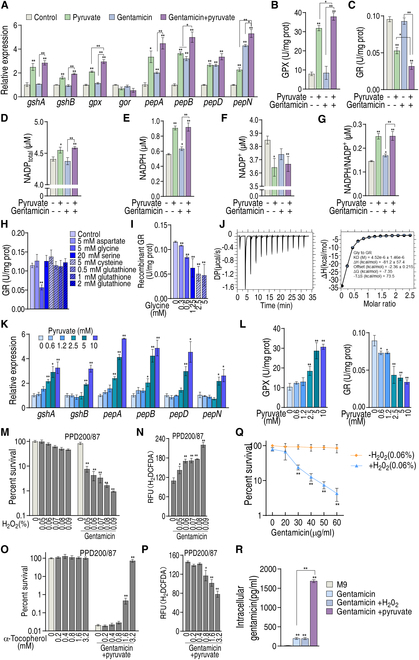
Fig. 5..

Glutathione metabolism and relationship between ROS and gentamicin killing. (A) qRT-PCR for expression of genes encoding glutathione metabolism in PPD200/87. (B and C) Activity of GPX (B) and GR (C) of PPD200/87 in the absence or presence of 60 μg/ml gentamicin and/or 5 mM pyruvate. (D to G) NADPtotal (D), NADPH (E), NADP+ (F), and NADPH/NADP+ (G) of PPD200/80 in the absence or presence of 60 μg/ml gentamicin and/or 5 mM pyruvate. (H) Activity of GR in the presence of the indicated concentrations of the indicated metabolites. (I) Activity of recombinant GR in the presence of the indicated concentrations of glycine. (J) ITC for identifying the binding of glycine with recombinant GR. (K) qRT-PCR for expression of genes encoding cysteine to GSH and GSH to glycine in the presence of the indicated concentrations of pyruvate. (L) Activity of GPX and GR in the presence of the indicated concentrations of pyruvate. (M) Survival of PPD200/87(108 CFU/ml) in the presence of the indicated concentration of H2O2 plus 60 μg/ml gentamicin. (N) ROS of PPD200/87 in the presence of the indicated concentration of H2O2 plus 60 μg/ml gentamicin. (O) Survival of PPD200/87 (108 CFU/ml) in the presence of the indicated concentration of α-tocopherol plus 60 μg/ml gentamicin and 5 mM pyruvate. (P) ROS of PPD200/87 in the presence of the indicated concentration of α-tocopherol plus 60 μg/ml gentamicin and 5 mM pyruvate. (Q) Survival of PPD200/87 in the presence of H2O2 and the indicated concentrations of gentamicin. (R) Intracellular gentamicin of PPD200/87 in the presence of pyruvate or H2O2. Results are displayed as the mean ± SD, and statistically significant differences are identified by Kruskal–Wallis followed by Dunn’s multiple comparison post hoc test unless otherwise indicated. *P < 0.05 and **P < 0.01.
