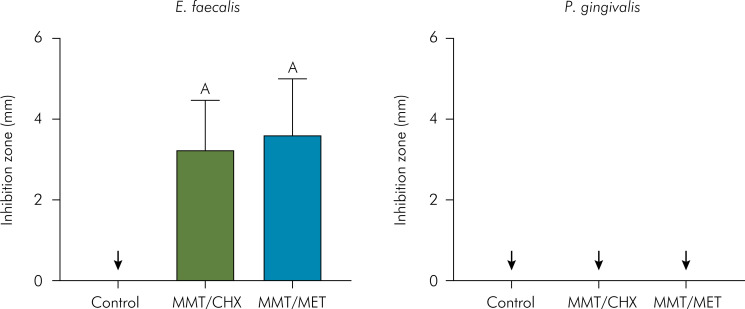
Figure 3. Mean values and standard deviations of the inhibition zones in mm for the tested control and experimental groups against E. faecalis and P. gingivalis.
MMT: montmorillonite; CHX: chlorhexidine; MET: metronidazole Statistically significant differences between groups are denoted by distinct capital letters (p < 0.05). Arrows in the graph indicates that no inhibition zones were observed across the samples, suggesting no antimicrobial activity against the tested bacterial strains.

