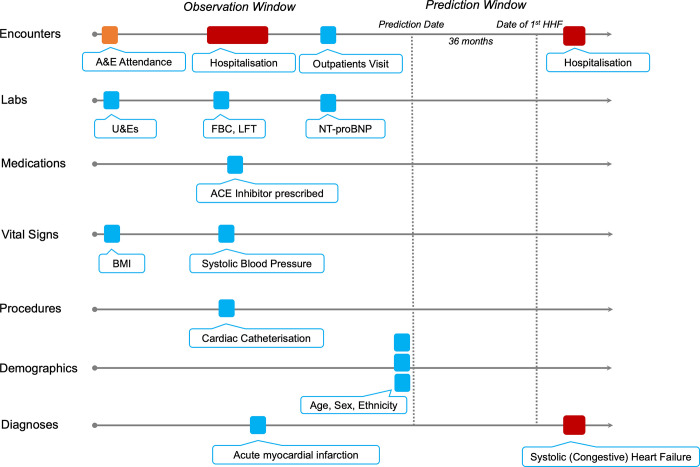
Fig 1. Schematic representation of an EHR vector.
The patient’s timeline is represented by horizontal arrows and each data point is depicted by colour-coded tokens. Predictive models were trained on the data in the Observation Window, whilst a binary outcome for first HHF was used as a ground truth.

