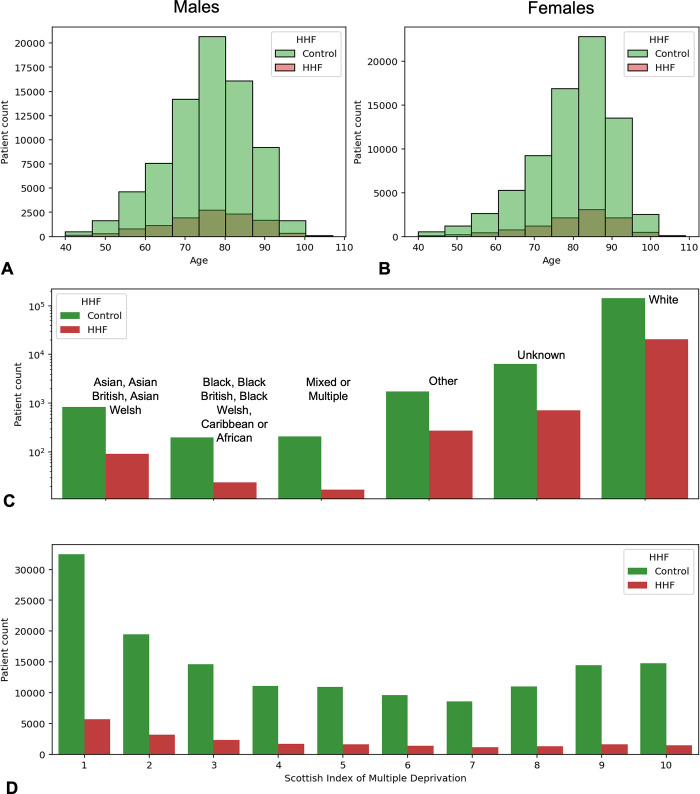
Fig 2. Demographic characteristics of the dataset.
A, B) Histograms of patient age distributions at Prediction Date. Green and Red bars reflect patients without and with first HHF. C) Bar plots demonstrating incidence of first HHF (red) and Controls (green) across broad ethnicity groupings. D) Bar demonstrating incidence of first HHF (red) and Controls (green) across Scottish Index of Multiple Deprivation (SIMD) deciles. Patients in the most and least deprived 10% of the population have SIMDs of one and ten respectively.

