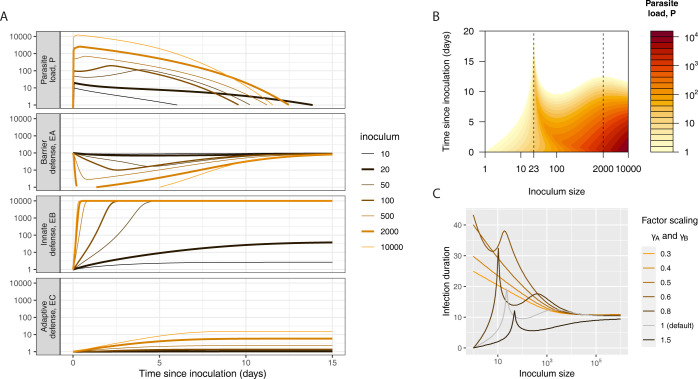
Fig 1.
(A) Time courses of parasite load (top row) and immune effectors of all three tiers (second, third, and fourth rows, corresponding to barrier, innate, and adaptive tiers, respectively) for varying inoculum sizes (doses). Intermediate inoculum sizes cause the longest infections due to how they interact with the series of defense tiers. The parasite loads in the top row start out at 0 and ramp up quickly to the inoculum dose within one hour, consistent with our implementation of the bolus inoculation (see S1 Code). (B) Time-course of parasite load for the varying doses displayed as a contour plot. (These are the same simulation data as shown in (A)). In this contour plot, it is more clearly visible that infection duration (in days since inoculation, on the y-axis) is longest at doses 20 and 2000, even if peak parasite load (colored according to heatmap P, at right) is highest in hosts receiving the largest dose. These simulations are based on the default parameterization of our model (see Model Parameterization and Scenarios as well as S1 Code.) (C) Infection duration versus inoculating dose for varying strengths of the first- and second-tier immune responses. The efficacy parameters of the first and second tier defenses, γA/γB, have been scaled to keep their relative efficacies constant. The two peaks of infection duration are at lower doses for weaker immune responses, and for very weak responses they disappear completely, showing that the peaks in the relationship between duration and inoculum size are determined by the strength of first- and second-tier defenses.

