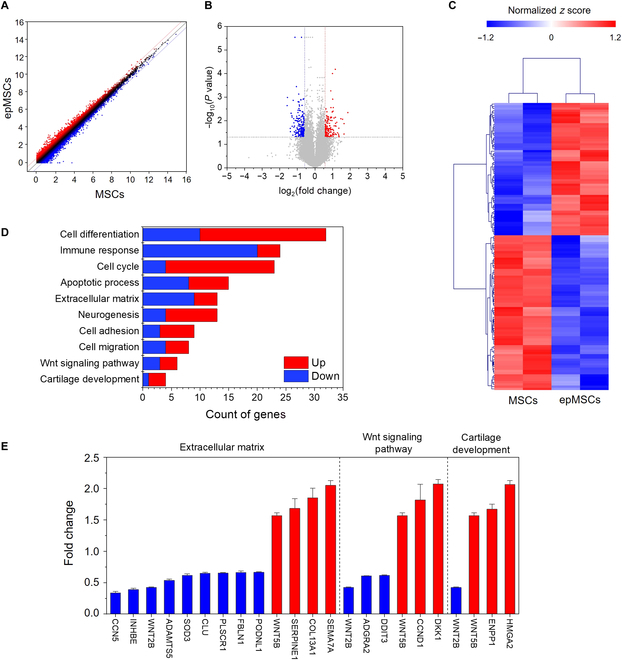
Fig. 7.

Total RNA sequencing of MSCs and epMSCs (n = 3 for each group). (A) Comparison of gene expression as a scatter plot between MSCs and epMSCs. (B) Volcano plot of −log10(P value) versus log2(fold change) in the expression of MSCs versus epMSCs. (C) Hierarchical clustering analysis based on the average gene expression compared by Euclidean distance coefficients. (D) Identification of the top 10 enriched Gene Ontology (GO) terms related to genes exhibiting significant expression changes induced by electrical stimulation. (E) Specific gene expression profiles of selected GO categories, including extracellular matrix, Wnt signaling pathway, and cartilage development. Red and blue colors indicate the up-regulation and down-regulation of each gene, respectively. HMGA2, high mobility group A2; ENPP1, ectonucleotide pyrophosphatase/phosphodiesterase 1; WNT2B, wingless-type mouse mammary tumor virus integration site; DKK1, Dickkopf-1; CCND1, cyclin D1; DDIT3, DNA damage-induced transcript 3; ADGRA2, adhesion G protein-coupled receptor A2; SEMA7A, semaphorin 7A; COL13A1, type XIII collagen alpha 1 chain; SERPINE1, serpin family E member 1; PODNL1, podocan-like protein 1; FBLN1, fibulin-1; PLSCR1, phospholipid scramblase 1; CLU, clusterin; SOD3, superoxide dismutase 3; ADAMTS5, a disintegrin and metalloproteinase with thrombospondin motifs 5; INHBE, inhibin subunit beta E; CCN5, cellular communication network factor 5.
