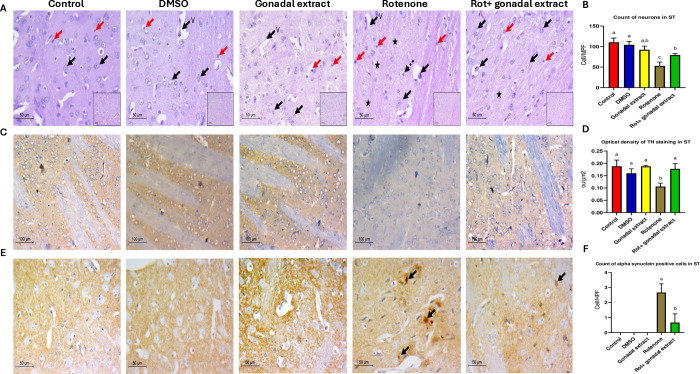
Fig 4.
A) Pathologic assessment of H&E-stained sections of the striatum in different studied groups: control, DSMO, and gonadal extract groups show a cellular striatum, high power shows viable neurons with large, rounded nuclei with open chromatin and a nucleolus (black arrows), few microglial cells (red arrows) and thin capillaries are seen (v). The rotenone group shows evident disturbed architecture and hypocellularity, high power shows few viable neurons (black arrows), and multiple degenerated neurons with dark stained nuclei (Dashed arrows), the background shows vacuolated neuropil (star) and increased microglial cells (red arrows). The gonadal extract-treated rotenone group shows improvement of architecture of the striatum, high power shows viable neurons (arrows) with residual focal neuropil vacuolation (star), and few microglial cells are seen (red arrows) (H&E, low power x200, scale bar = 100 microns, high power x400, scale bar = 50 microns). B) Count of neurons in the striatum in different groups. C) Pathologic assessment of tyrosine hydroxylase-stained sections of the striatum in different studied groups highlighting positive dopaminergic terminals in each group. A high-density deep brown background is seen in the control, DSMO, and gonadal extract groups. The Rotenone group shows decreased staining density, while the gonadal extract-treated rotenone group shows increased staining. (IHC, x200, scale bar 100 microns, inset x100). D) Optical density of TH staining in the striatum. E) Pathologic assessment of α- -synuclein stained sections of striatum in different studied groups highlighting positive neurons in each group. Negative staining of neurons is seen in control, DSMO, and gonadal extract groups. The Rotenone group shows multiple positive α—synuclein neurons (arrows), while the gonadal extract-treated rotenone group shows decreased expression. (IHC, x400, scale bar 50 microns). F) Count of α—synuclein positive cells in the striatum. All the data were analyzed using one-way ANOVA followed by Tukey Pairwise Comparisons. Values are expressed as mean ± SEM; n = 3 rats for each group. Different superscripts on the columns are significantly different at p≤0.05.

