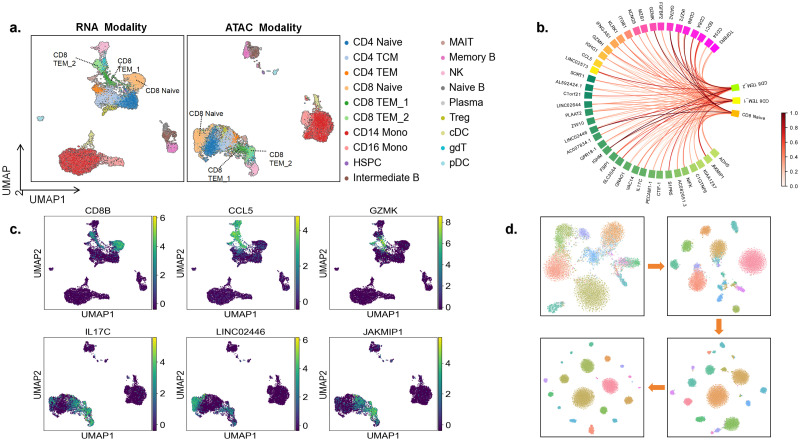
Fig 6. Interpretability analysis diagram of scMoMtF.
A Visualize the location of the cell subtype of CD8+ T cells in both the RNA and ATAC modalities. B The characteristics with high contribution in CD8+ T cells are normalized to a value between 0 and 1. C The expression degree of CD8B, CCL5 and GZMK in RNA modality and the expression degree of IL17C, LINC02446 and JAKMIP1 in ATAC modality. D Visualize the cell embedding of scMoMtF at different training periods using t-SNE.

