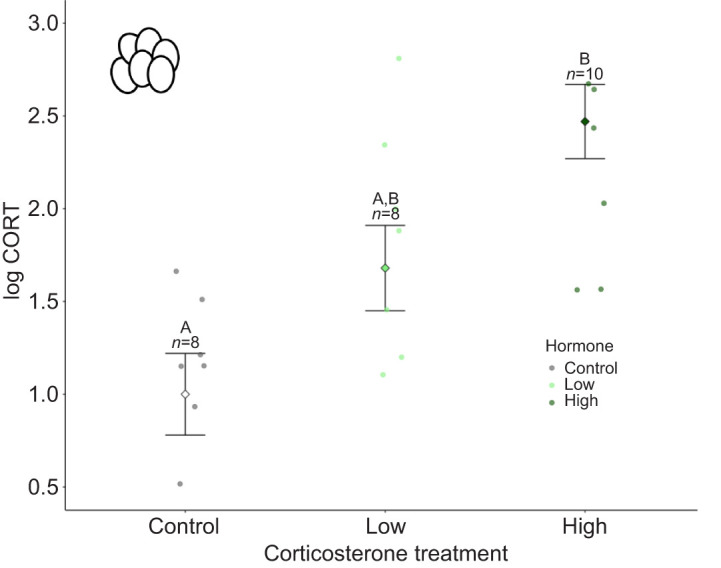
Fig. 2.

Yolk corticosterone levels (log transformed) following control, low dose corticosterone and high dose corticosterone treatments. Marginalised mean estimates (mean and s.e.) are provided based on a model that accounted for corticosterone developmental treatment and test plate effects on yolk corticosterone levels. Significant differences (P<0.05) from post hoc tests are indicated by different letters. Sample sizes (n) for each treatment are indicated above error bars.
