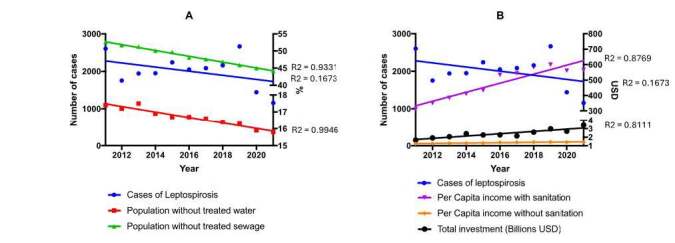
Figure 1. Time series analysis of leptospirosis cases, sanitation, income, and public sanitation investment in Brazil.

Note: A: number of cases × percentage × year. B: number of cases × Brazilian reais × year. The counting in billions is expressed at the bottom of the z-axis. Markings represent the disper sion of the points and the regression line for each variable, with their respective R² values.
