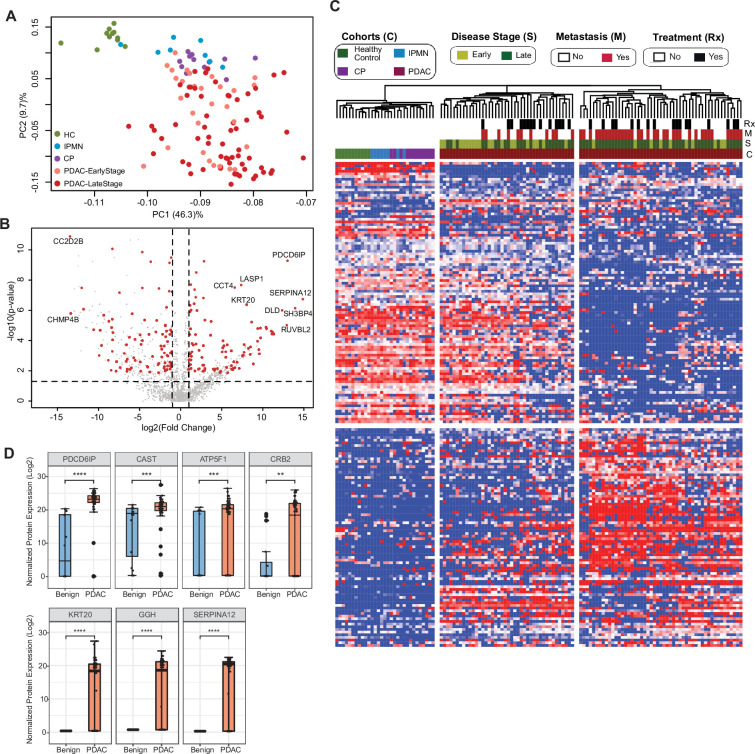
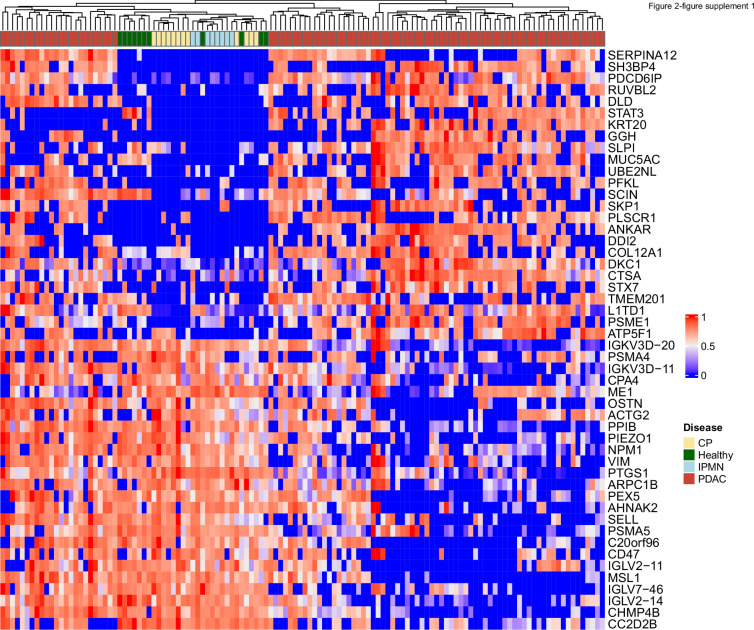
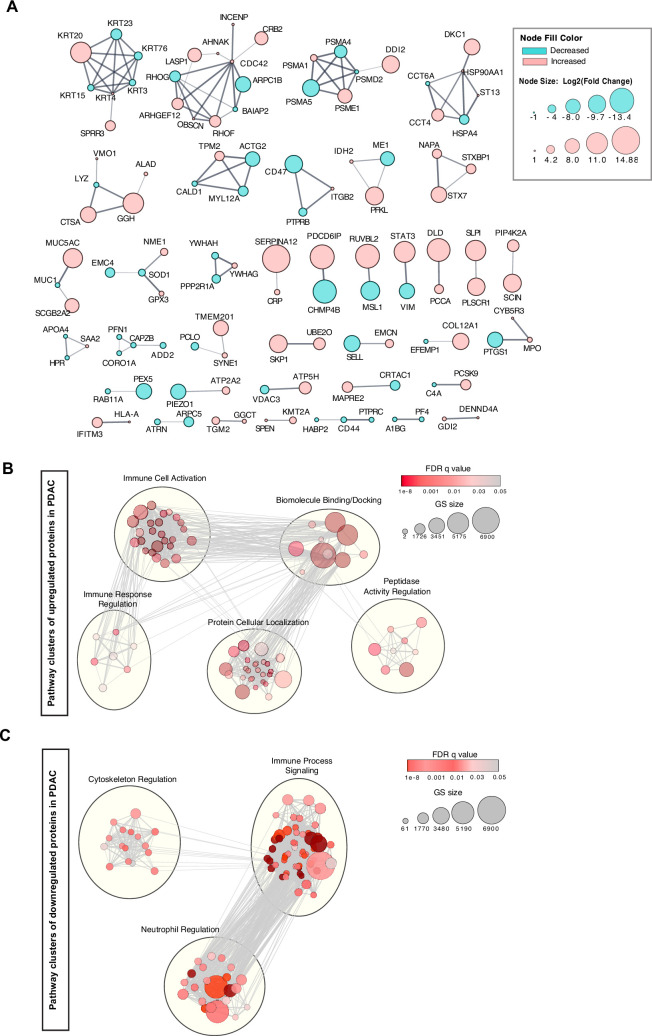
Figure 2. Identification of cEV proteins differentially expressed in disease groups.
(A) Principal component analysis of cEV proteins differentially expressed in the plasma of patients with pancreatic diseases compared to controls. Each dot indicates one individual enrolled in the study: green, controls; blue, patients with intraductal papillary mucinous neoplasm (IPMN); purple, patients with chronic pancreatitis (CP); salmon, early stage (stages I and II) pancreatic ductal adenocarcinoma (PDAC); red, late stage (stages III and IV) PDAC. (B) Volcano plot of circulating EV proteins enriched in the plasma of patients with PDAC versus benign pancreatic diseases. X-axis, log base 2 of fold changes; Y-axis, negative of the log base 10 of p values. (C) Heatmap of cEV proteins differentially expressed in the plasma of patients with pancreatic diseases compared to controls. Designations of clinical parameters were indicated at the top of the heatmap. (D) Expression of enriched cEV proteins in patients with PDAC (N=93) versus benign pancreatic diseases (N=20). Each dot indicates the target protein signal from one patient. Y-axis, normalized log base 2 of protein signals detected by mass spectrometry; Error bars, min and max values; lines in boxes, median values. * p≤0.05, ** p≤0.01, *** p≤0.001, **** p≤0.0001.


