. 2024 Dec 18;13:RP92418. doi: 10.7554/eLife.92418

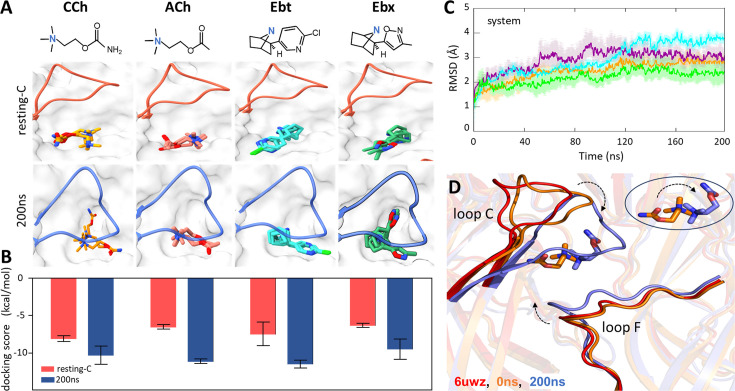
Figure 2. Agonist docking and loop dynamics.

(A) Top, agonists (blue, cationic center): carbamylcholine (CCh), acetylcholine (ACh), epibatidine (Ebt), and epiboxidine (Ebx). Bottom, α−δ site with docked agonists (top three poses). Resting-C, 6UVW.pdb minus toxin (red): loop C is up and agonist is cis; 200 ns, after simulation and removal of CCh (blue): loop C is down and agonist is trans. (B) Bottom, for all four agonists the docking scores (mean ± SD, n=3) were more favorable after simulation. (C) Cα root-mean-square deviation (RMSD) (mean ± SD, triplicates) are stable after ~120 ns (ACh, cyan; CCh, green; Ebt, orange; Ebx, purple). (D) Close-up of the CCh-occupied pocket. Red, resting-C; orange, equilibrated (0 ns molecular dynamics, MD); blue, after 200 ns MD. IN the simulations, loop C flops down (arrow), loop F moves in, and the agonist flips cistrans (circled inset).

Figure 2—source data 1. Molecular dynamics (MD) simulation.
Average root-mean-square deviation (RMSD) values for protein, ligand, or the entire complex (protein + ligand) across individual MD simulation runs. SD, standard deviation; SEM, standard error of the mean.

Figure 2.

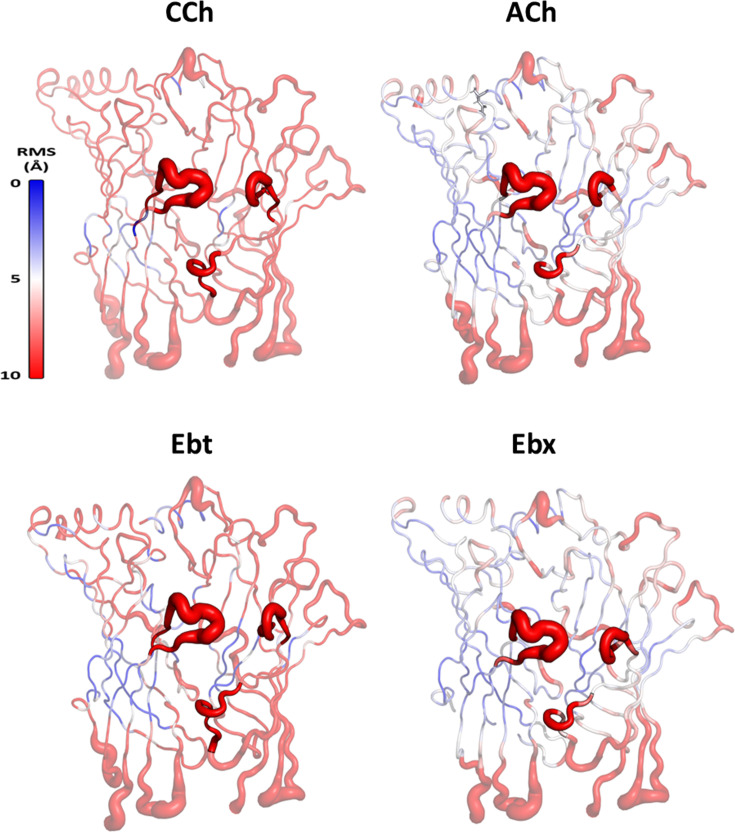
Figure 2—figure supplement 1. Root mean square fluctuation (RMSF) of Cα for the extracellular domain (ECD) of α-δ subunits.

Figure 2—figure supplement 1.

RMSF for carbamylcholine (CCh), acetylcholine (ACh), epibatidine (Ebt), and epiboxidine (Ebx) (structures in Figure 4A). Greatest fluctuations are in loops C and F that surround the orthosteric pocket; red-blue is the greatest-least fluctuations.
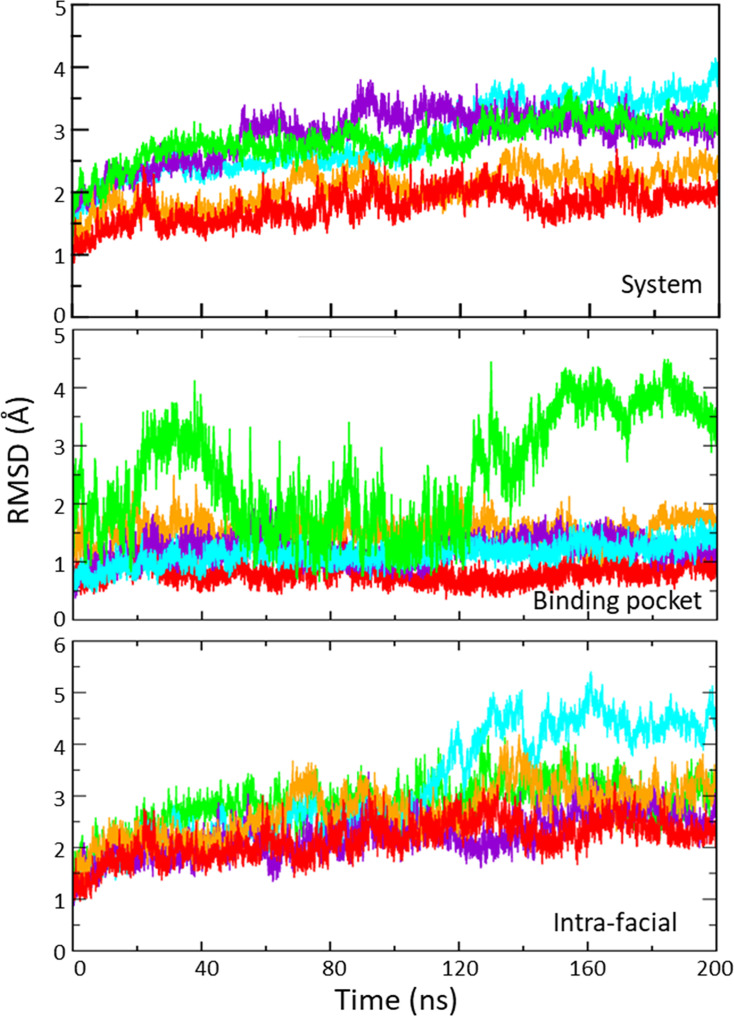
Figure 2—figure supplement 2. RMSD of pocket residues during molecular dynamics (MD) simulations.

Figure 2—figure supplement 2.

The root-mean-square deviation (RMSD) of binding pocket residues relative to their initial positions over the course of 200 ns MD simulations for each agonist (carbamylcholine, CCh in red, epibatidine EBt in orange, epiboxidine EBx in purple, acetylcholine ACh in blue, and apo in green). Agonists stabilize pocket residues (middle) but intra-facial residues (near the transmembrane domain (TMD) and adjacent subunits; lower) fluctuate similarly with and without agonists.
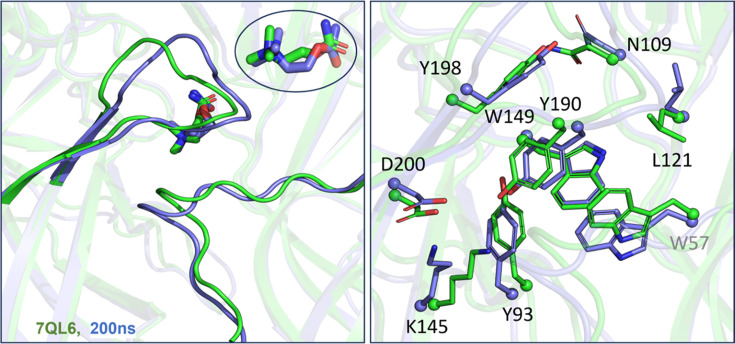
Figure 2—figure supplement 3. Alignment of molecular dynamics (MD) simulations (carbamylcholine, CCh).

Figure 2—figure supplement 3.

Left, loops. An overlay of the final MD configuration with CCh (putative ACH; blue) and the cryo-EM desensitized (ADH) structure with CCh (7QL6.PDB, green) shows strong overlap in loops C (top left) and F (bottom right) (root-mean-square deviation, RMSD=0.3). Insert: the agonist (trans orientation) also overlaps. In experiments, ACH and ADH have the same CCh binding free energy. Right, side-chains. The final MD structure (blue) aligns approximately with the desensitized, high-affinity conformation of the pocket (green).
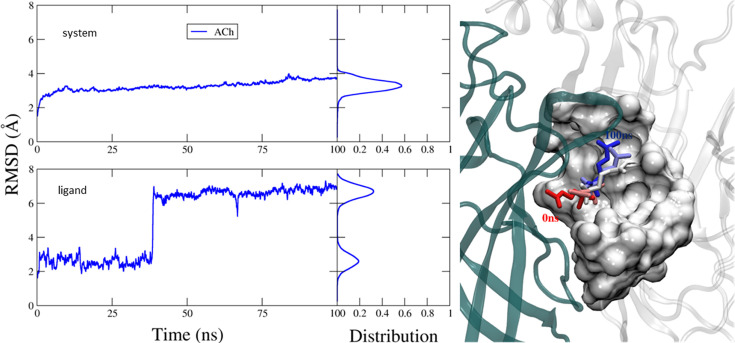
Figure 2—figure supplement 4. Molecular dynamics (MD) simulation of the pentameric system.

Figure 2—figure supplement 4.

Left, root-mean-square-deviation (RMSD) of the pentamer (top) and the ligand (bottom), in complex with docked acetylcholine (ACh) (100 ns MD simulation). Side panels are distribution plots. Right, the m1-m2-m3 changes in ACh conformation in the orthosteric cavity. The agonist’s orientation flips from cis (m1, at 0 ns; red) to trans (m3, at 200 nS; blue). m2 is in between. Similar structural changes are apparent in the dimer.
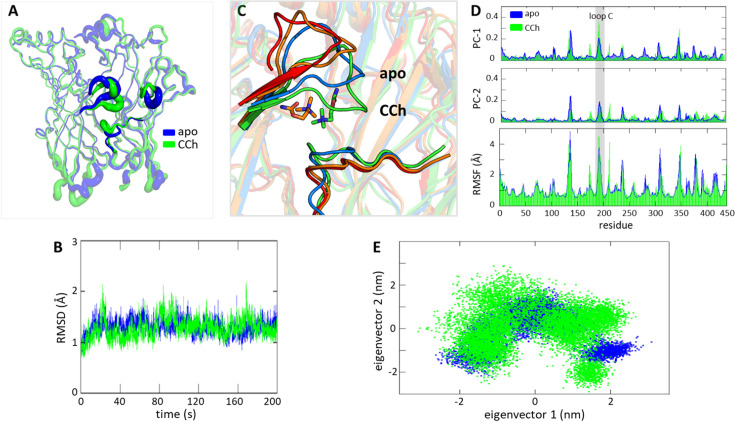
Figure 2—figure supplement 5. Conformational convergence between apo (blue) and with carbamylcholine (CCh) (green).

Figure 2—figure supplement 5.

(A) Root mean square fluctuation (RMSF) of Cα extracellular domain (ECD) shows similar regions of fluctuations, loops C and F that surround the pocket. (B) Root-mean-square-deviation (RMSD) of the system Cα. (C) Closeup of the α−δ orthosteric pocket showing displacements of loop C (flop) and loop F; blue, apo; red, 6UWZ; orange CCh 0 ns; green, CCh 200 ns. (D) RMSF shows loop C movement (gray highlight) is closely aligned with key conformational shifts observed in the primary two principal components (PC1 and PC2). (E) A 2D scatter plot of the first two principal components derived from the simulation data for apo superimposed with CCh; cluster overlaps indicate that similar stable conformations were explored.