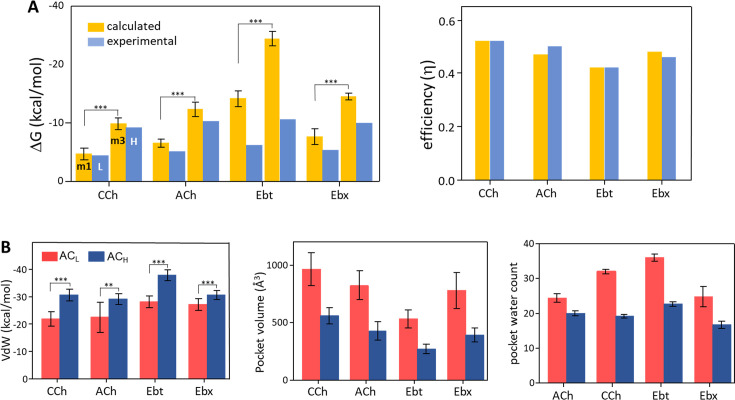
Figure 4. Binding free energies and pocket properties.
(A) Calculated (yellow) versus experimental (blue) binding free energies for four agonists (structures in Figure 2A, top) (Figure 4—source data 1). Poisson-Boltzmann Surface Area (PBSA) calculations were done on clusters selected from m1 and m3 minima of principal component analysis (PCA) plots (Figure 3; Figure 3—figure supplement 2). Left, absolute ΔG, and right, efficiency (1-ΔGL/ΔGH). The agreement in efficiencies supports the hypothesis that m1 represents ACL and m3 represents ACH (B) In L→H (red→blue), VdW interactions (left) increase, pocket volume (center) decreases, and the number of water molecules in the pocket (right) decreases. Overall, the pocket stabilizes, compacts, and de-wets.

