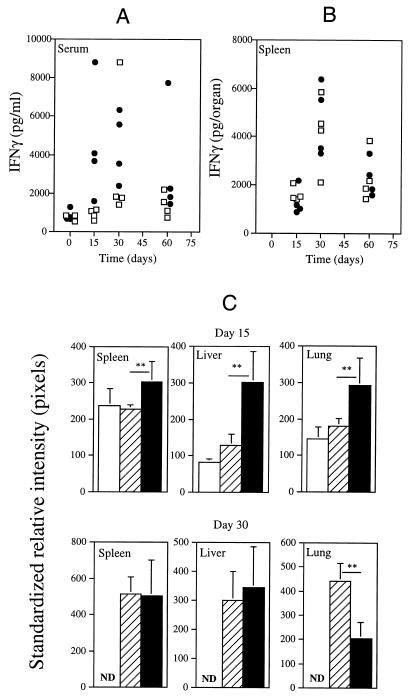
FIG. 2.
Amounts of immunoreactive IFN-γ in the sera (A) and spleen homogenates (B) of C57Bl/6 mice infected at the indicated time points with M. avium strains 2447 (open squares) or 25291 (solid circles). Each point represents the determination of IFN-γ from one animal. (C) Analysis by RT-PCR of IFN-γ gene expression in the spleens, livers, and lungs of C57Bl/6 mice infected with M. avium strains 2447 or 25291 at days 15 and 30 of infection and of uninfected control mice. Southern blotting of the PCR products for HPRT and IFN-γ was performed with 32P-labeled probes, and the photographic plates were scanned and analyzed. The data are presented as the means ± 1 standard deviation of the corrected results (standardized for the HPRT message) in terms of the intensity of the reading in pixels. The open bars represent the signal for uninfected mice, the hatched bars represent those of strain 2447-infected mice, and the solid bars represent those of strain 25291-infected mice. Independent analysis of the results for days 15 and 30 was done, and therefore, exposure of the photographic plates differed between those time points, leading to different readings of the uninfected material. ND, not detected. Note that linear increases in intensity (in pixels) correspond to exponential increases in PCR product under the conditions used here. Statistically significant differences according to Student’s t test are labeled ∗ (P < 0.05) or ∗∗ (P < 0.01).

