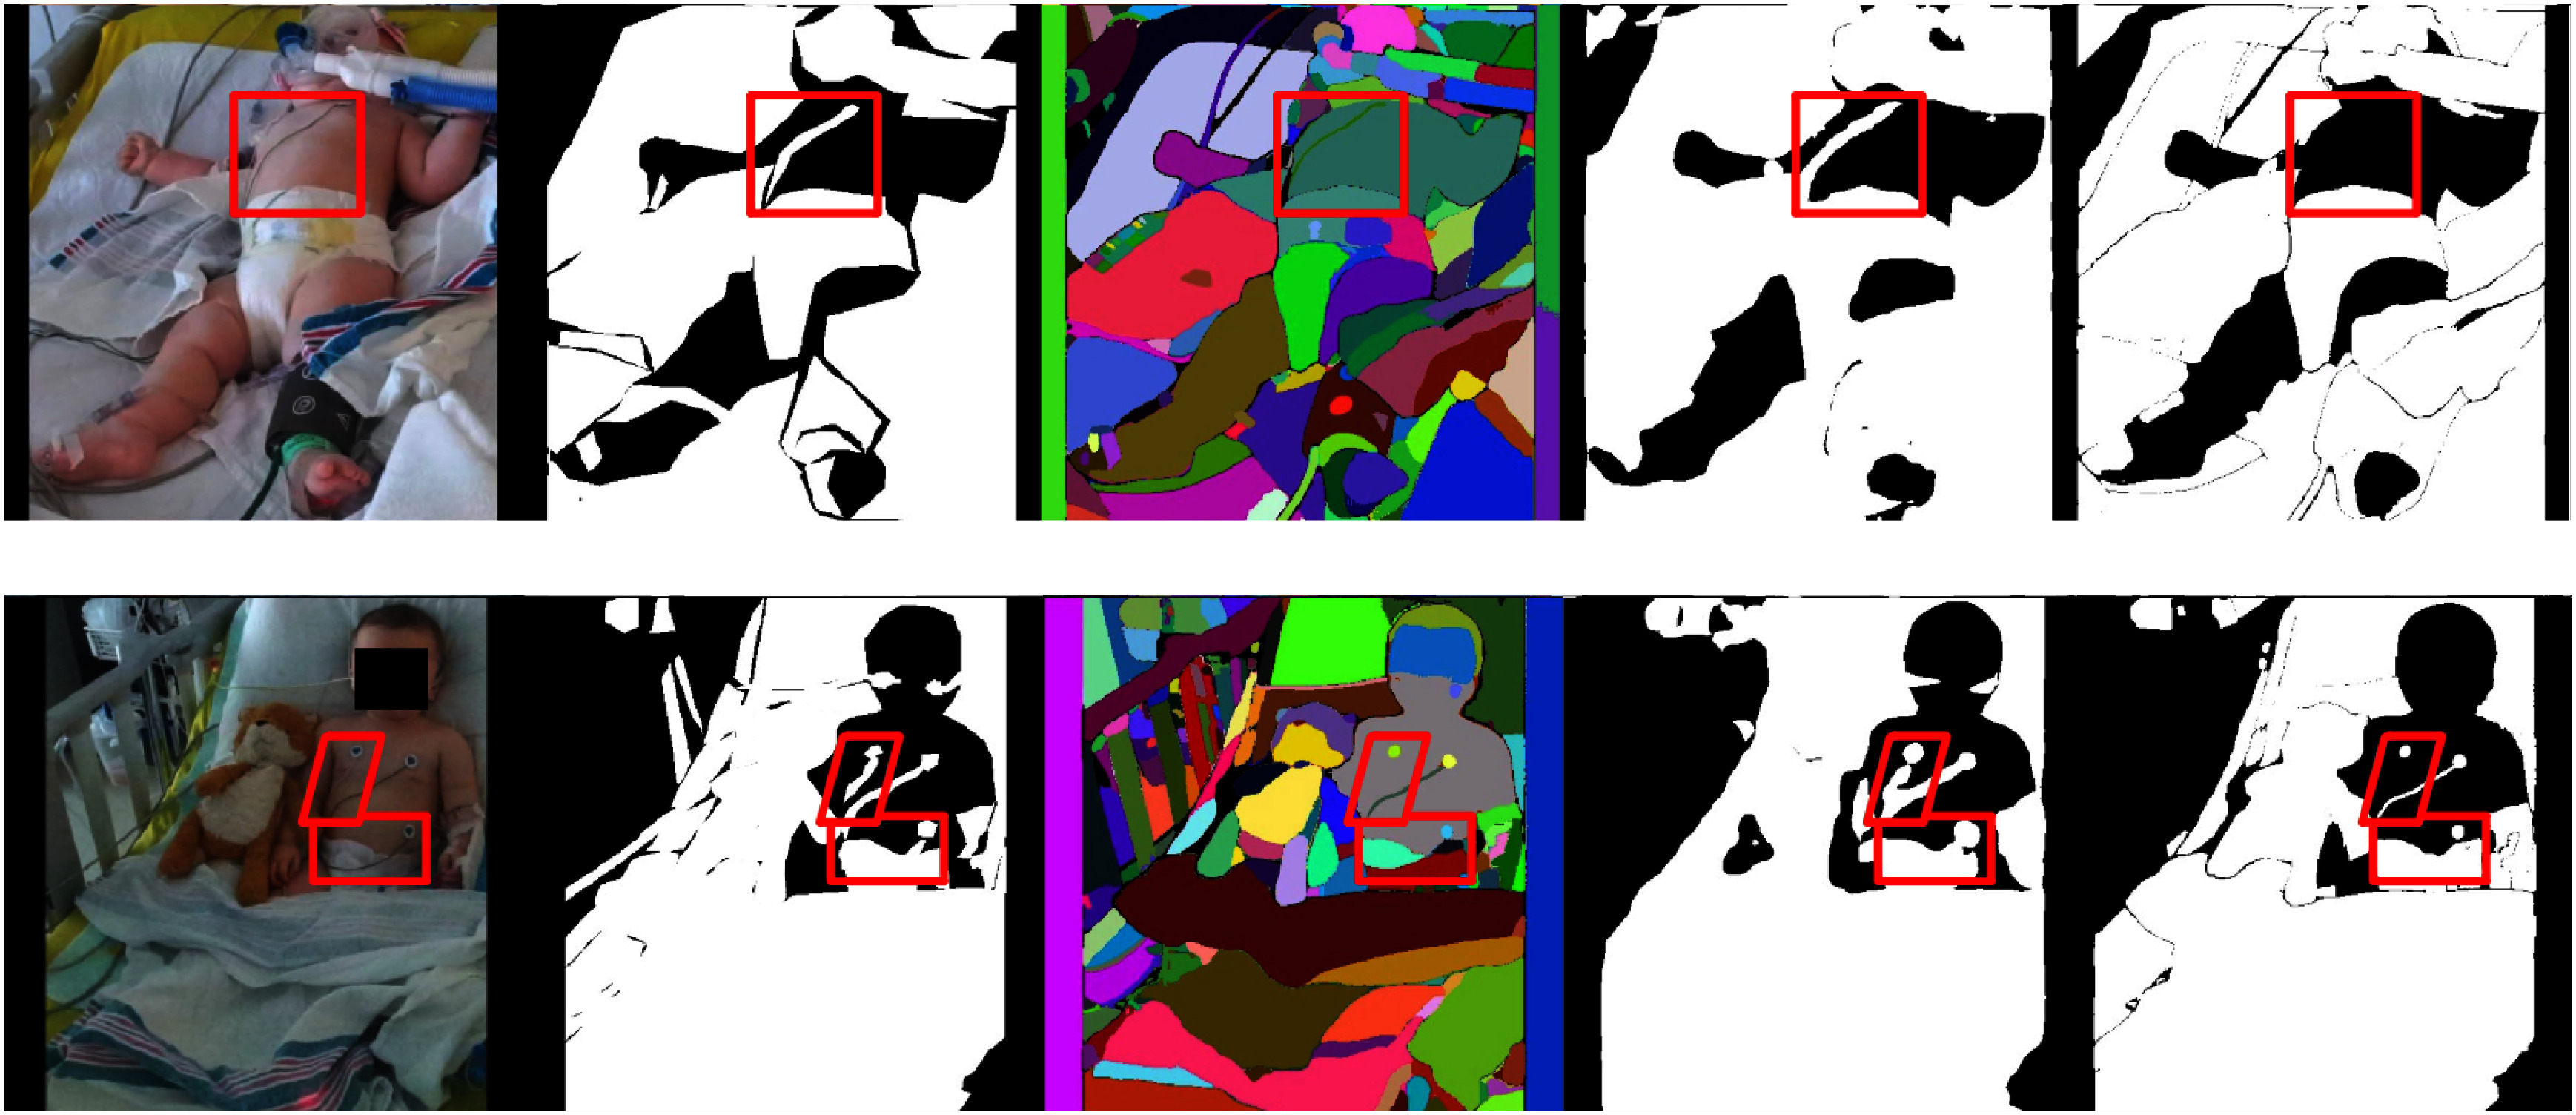
Fig. 6.

Failure examples of SOSS. From left to right: input images ( column), ground truths (
 column), SAM masks (
 column), predictions from
  (
( column), and final binary occlusion segmentation mask (
 column). In the
  and
and  columns, white regions are classified as occlusions while black ones are classified as non-occlusions. In the
  column, different colors simply indicate different image segments without associated occlusion class, which is the main shortcoming of SAM in our task. Red boxes highlight occlusion segmentation failures.
