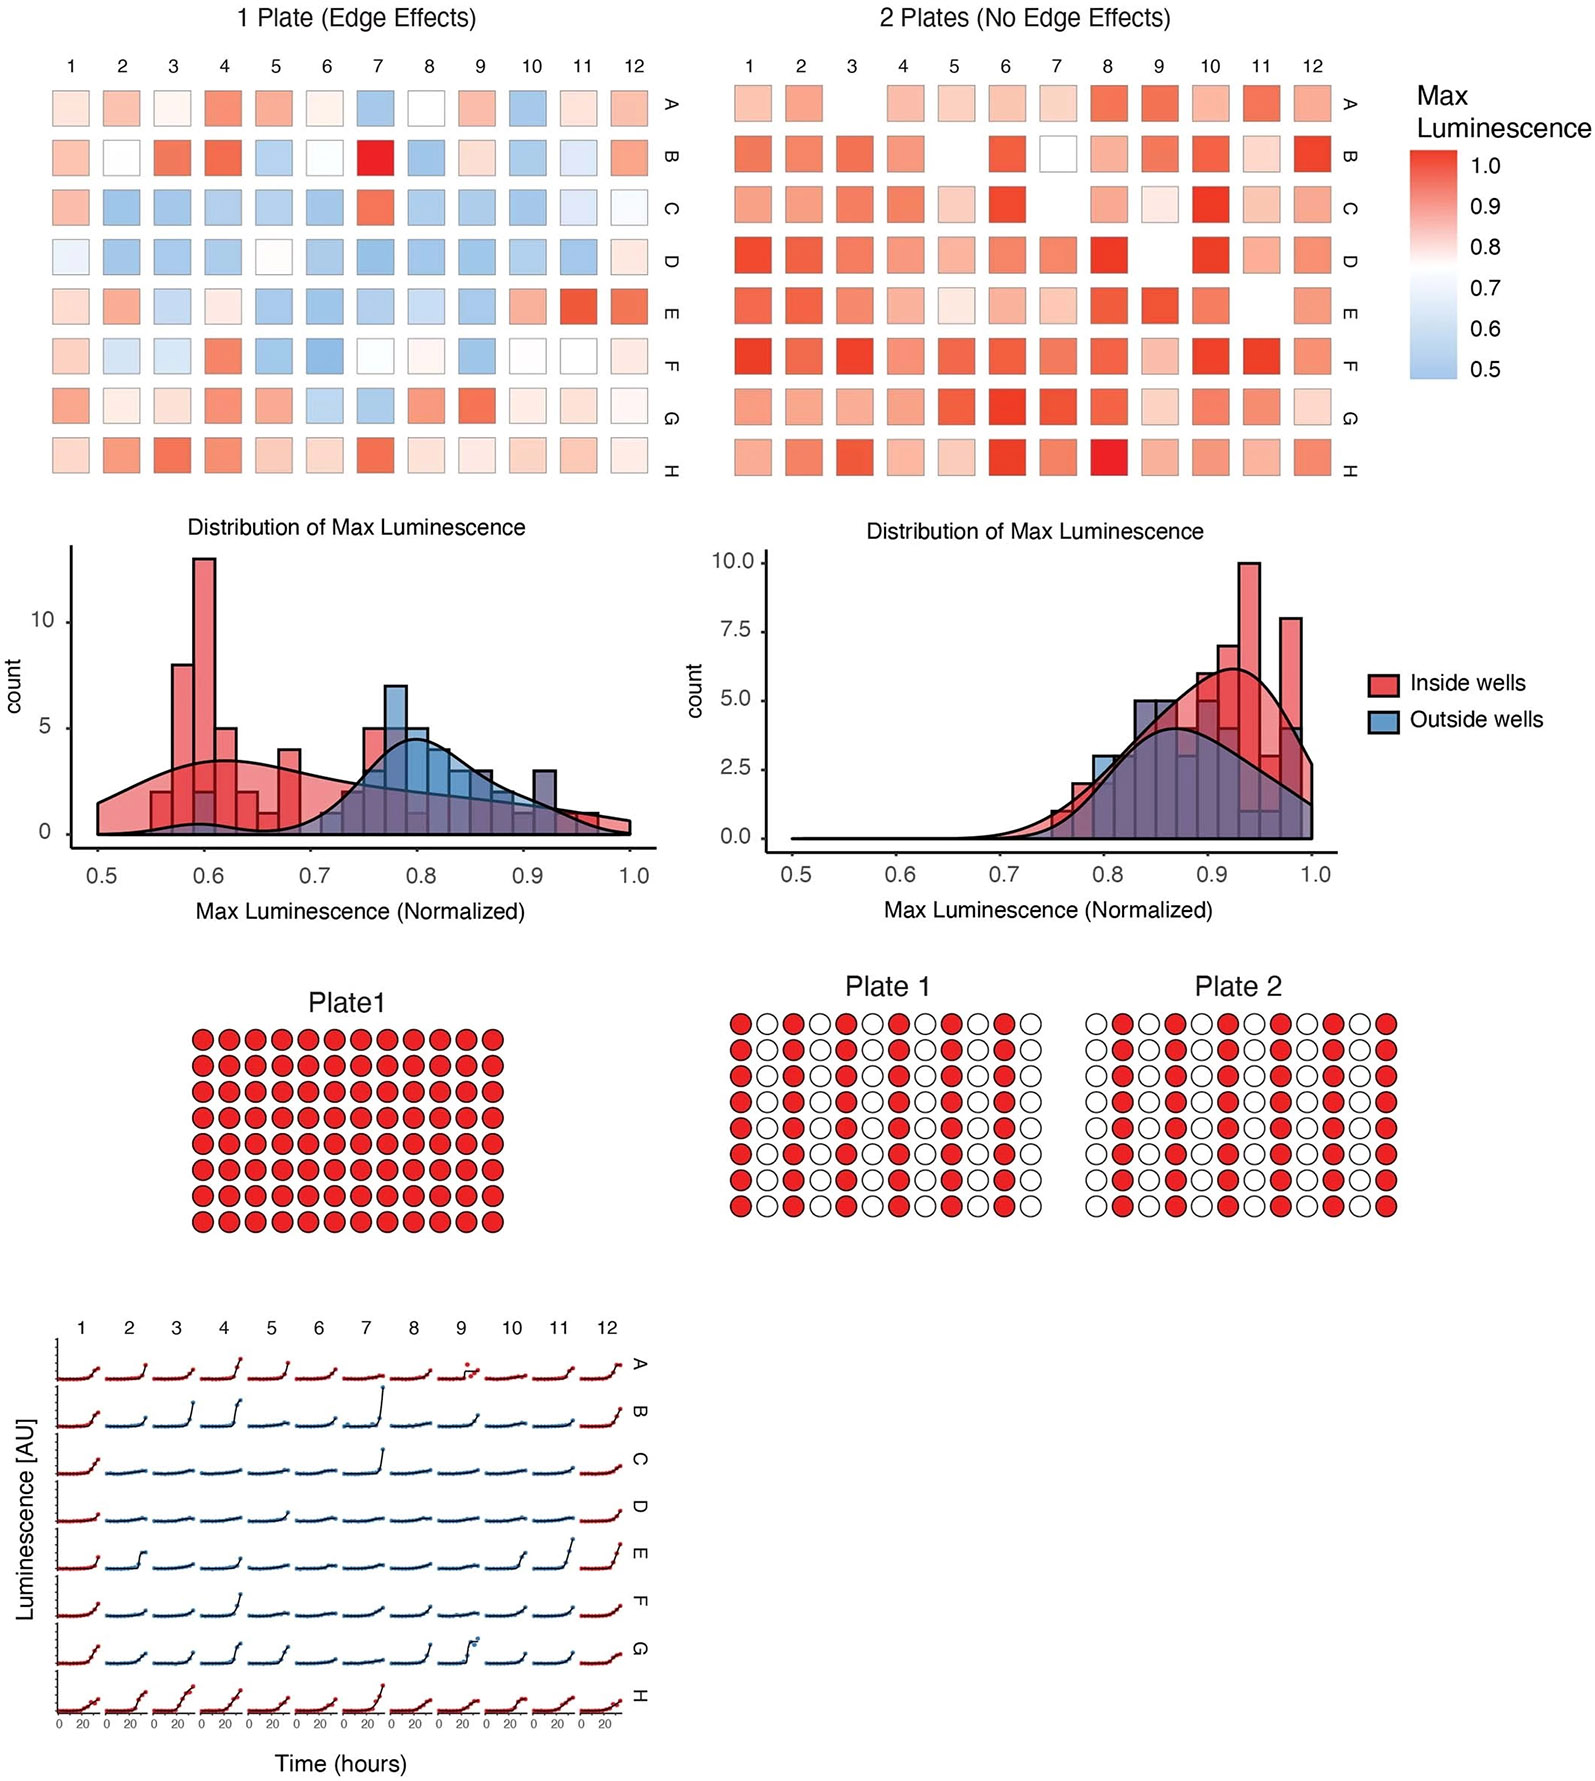
Extended Data Fig. 7 ∣. Edge effects.

Comparison between 96 replicates implemented in a densely packed 96-well plate (left) and 96 replicates split over two plates to reduce edge effects (right). Data plots the minimum time to phage detection via luminescence monitoring (below). Both plates above are normalized to their internal max value.
