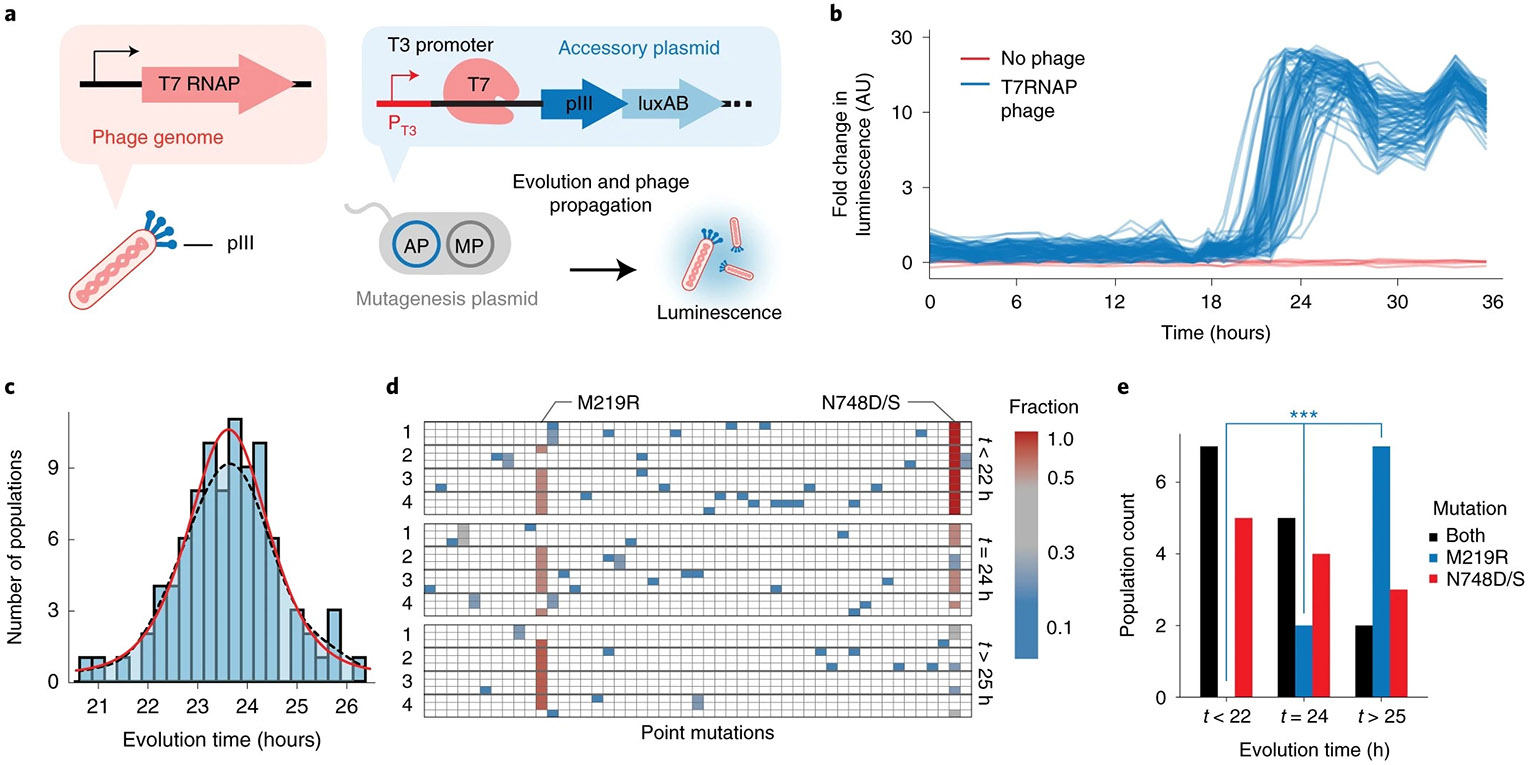
Fig. 2 ∣. Quantifying the stochasticity of biomolecular evolution.

a, Strategy for evolving T7 RNAP to recognize the T3 promoter, in which expression of pIII is driven by the T3 promoter on an accessory plasmid and the evolving T7 RNAP is encoded on the replicating phage genome. b, Real-time luminescence monitoring of 90 simultaneous populations with six no-phage controls. c, Histogram of times required to acquire mutations permitting the T7 RNAP to recognize the T3 promoter, obtained from the inflection point of logistic regressions of each population (Extended Data Fig. 5, Methods and Data analysis). Smoothed fit is calculated with a kernel density estimate (black dashed line) or logistical distribution fit (red). d, Mutations observed from 12 representative populations that exhibited evolution of early (−1σ, t < 22 h), mid (mean, t = 24 h) and late (+1σ, t > 25 h) time points. Three clonal phage from each population are shown, filled-in boxes indicate a mutation at a given location and are colored by ‘fraction’ referring to the mutational frequency within the given time window (t < 22, t = 24, t > 25), where red is 12/12 clones, blue is 1/12 of the clones. Genotypes of subclones are listed in Supplementary Table 2. e, Frequency of mutations arising that exhibited evolution of early (−1σ, t < 22 h), mid (mean, t = 24 h) and late (+1σ, t > 25 h) time points. *** indicates time-dependent chi-square P = 0.0037.
