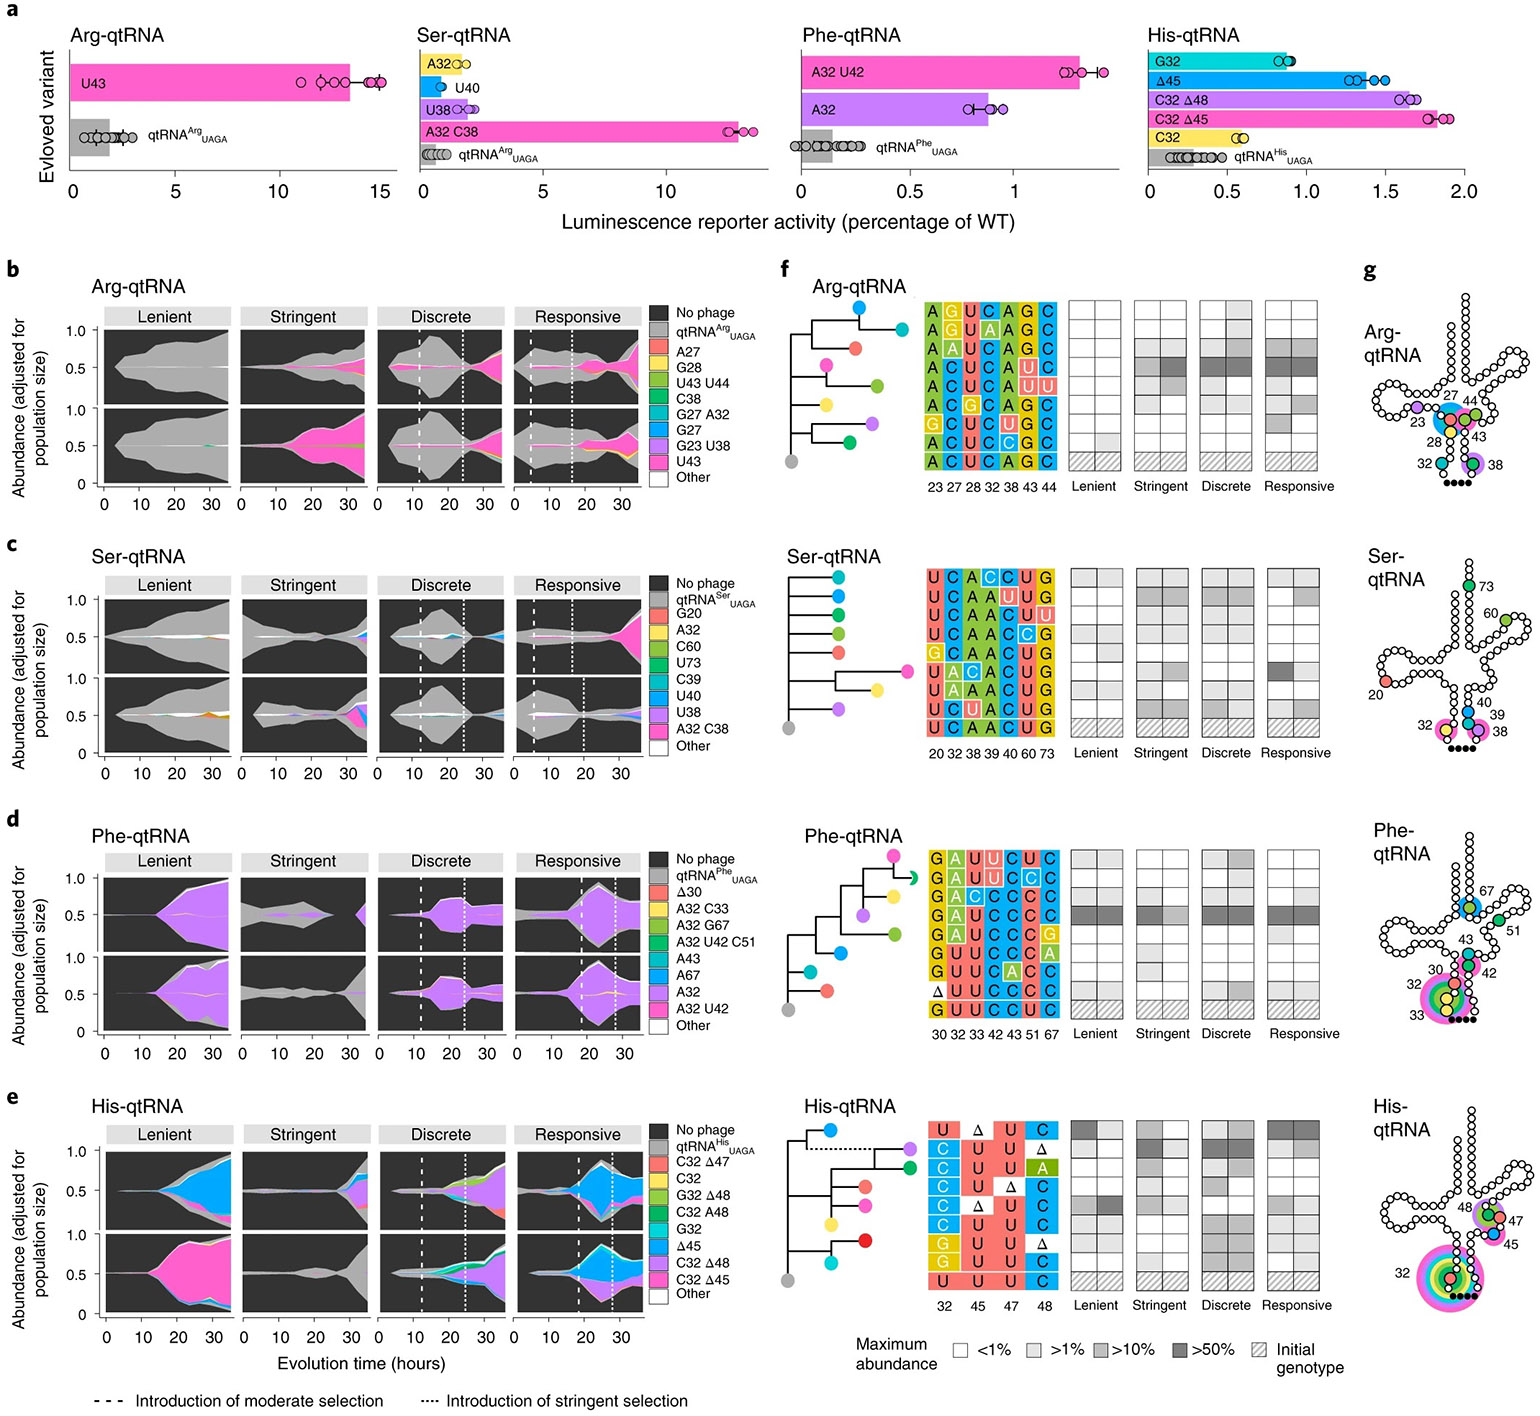
Fig. 5 ∣. Varying the timing of environmental changes yields diverse evolution trajectories.

a, Relative activity of the initial and evolved variants as measured by a kinetic luminescence assay. Data are presented as mean values ± s.e.m. for n = 3–8 biologically independent samples. b–e, Muller plots as abundance adjusted for population size for Arg-qtRNA (b), Phe-qtRNA (c), Ser-qtRNA (d) and His-qtRNA (e). The dashed line shows the introduction of moderate selection and the dotted line shows the introduction of stringent selection. f, Predicted phylogenetic relationship of the variants arising from evolution of each qtRNA, and their respective maximum population abundance between replicates. g, Location of mutations within the standard qtRNA secondary structure. The colors of variants arising in each evolution are consistent with the legends in Fig. 6b-e.
