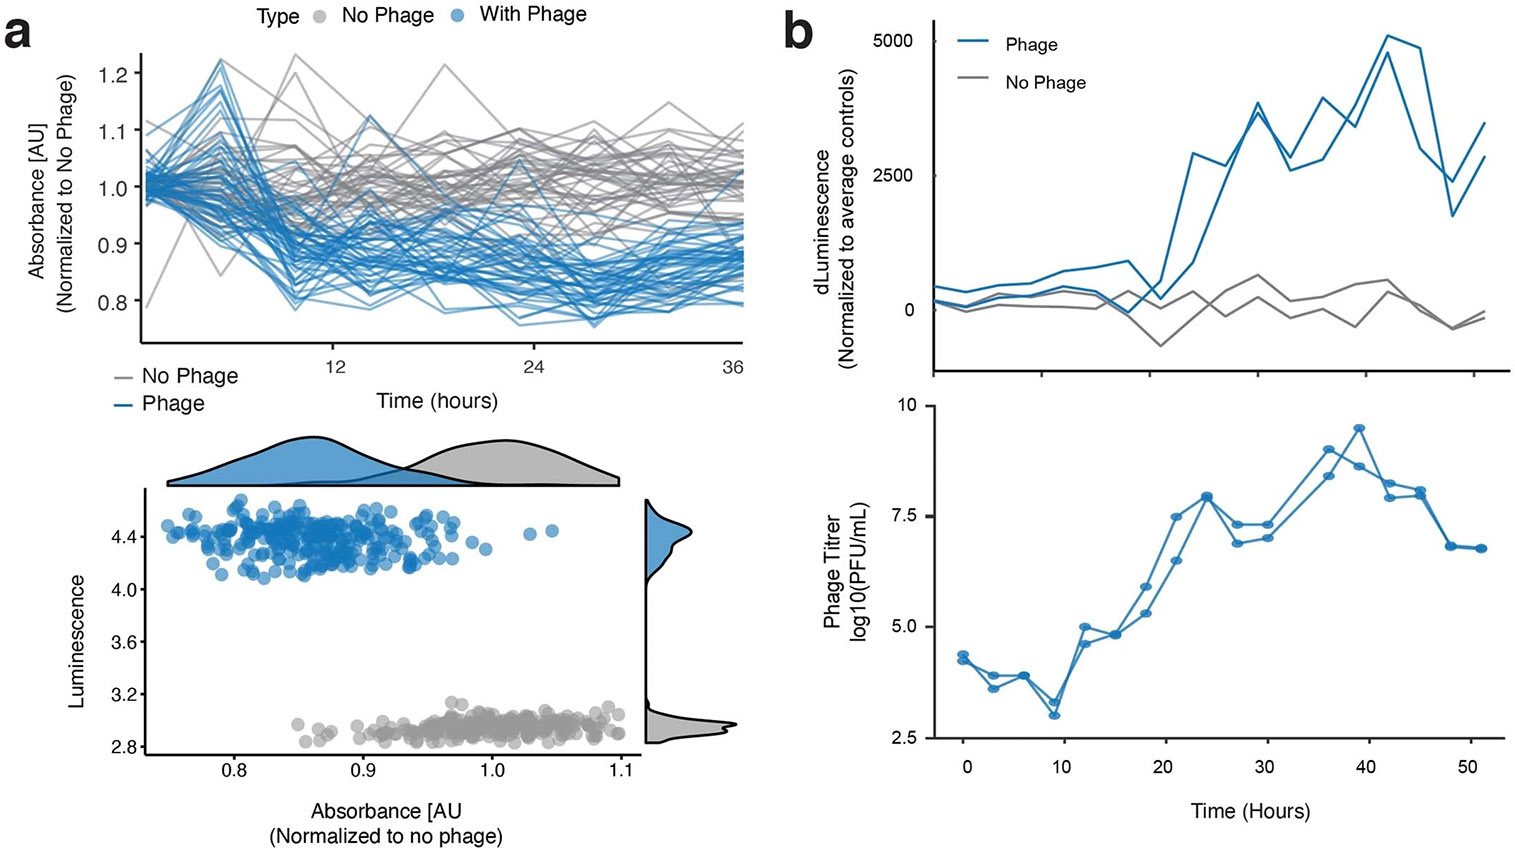
Extended Data Fig. 2 ∣. Relationship between real-time monitoring data and phage titer.

(a) Correlation between absorbance depression and luminescence for each evolving replicate. Kernel density estimates of the absorbance and luminescence data for the population are plotted on x and y axis, respectively. Luminescence data from Fig. 2b. (b) Comparison of real-time luminescence tracking (top) and corresponding phage titer as measured by traditional plaque assays (bottom). See Supplementary Table 1 for evolution construct details.
