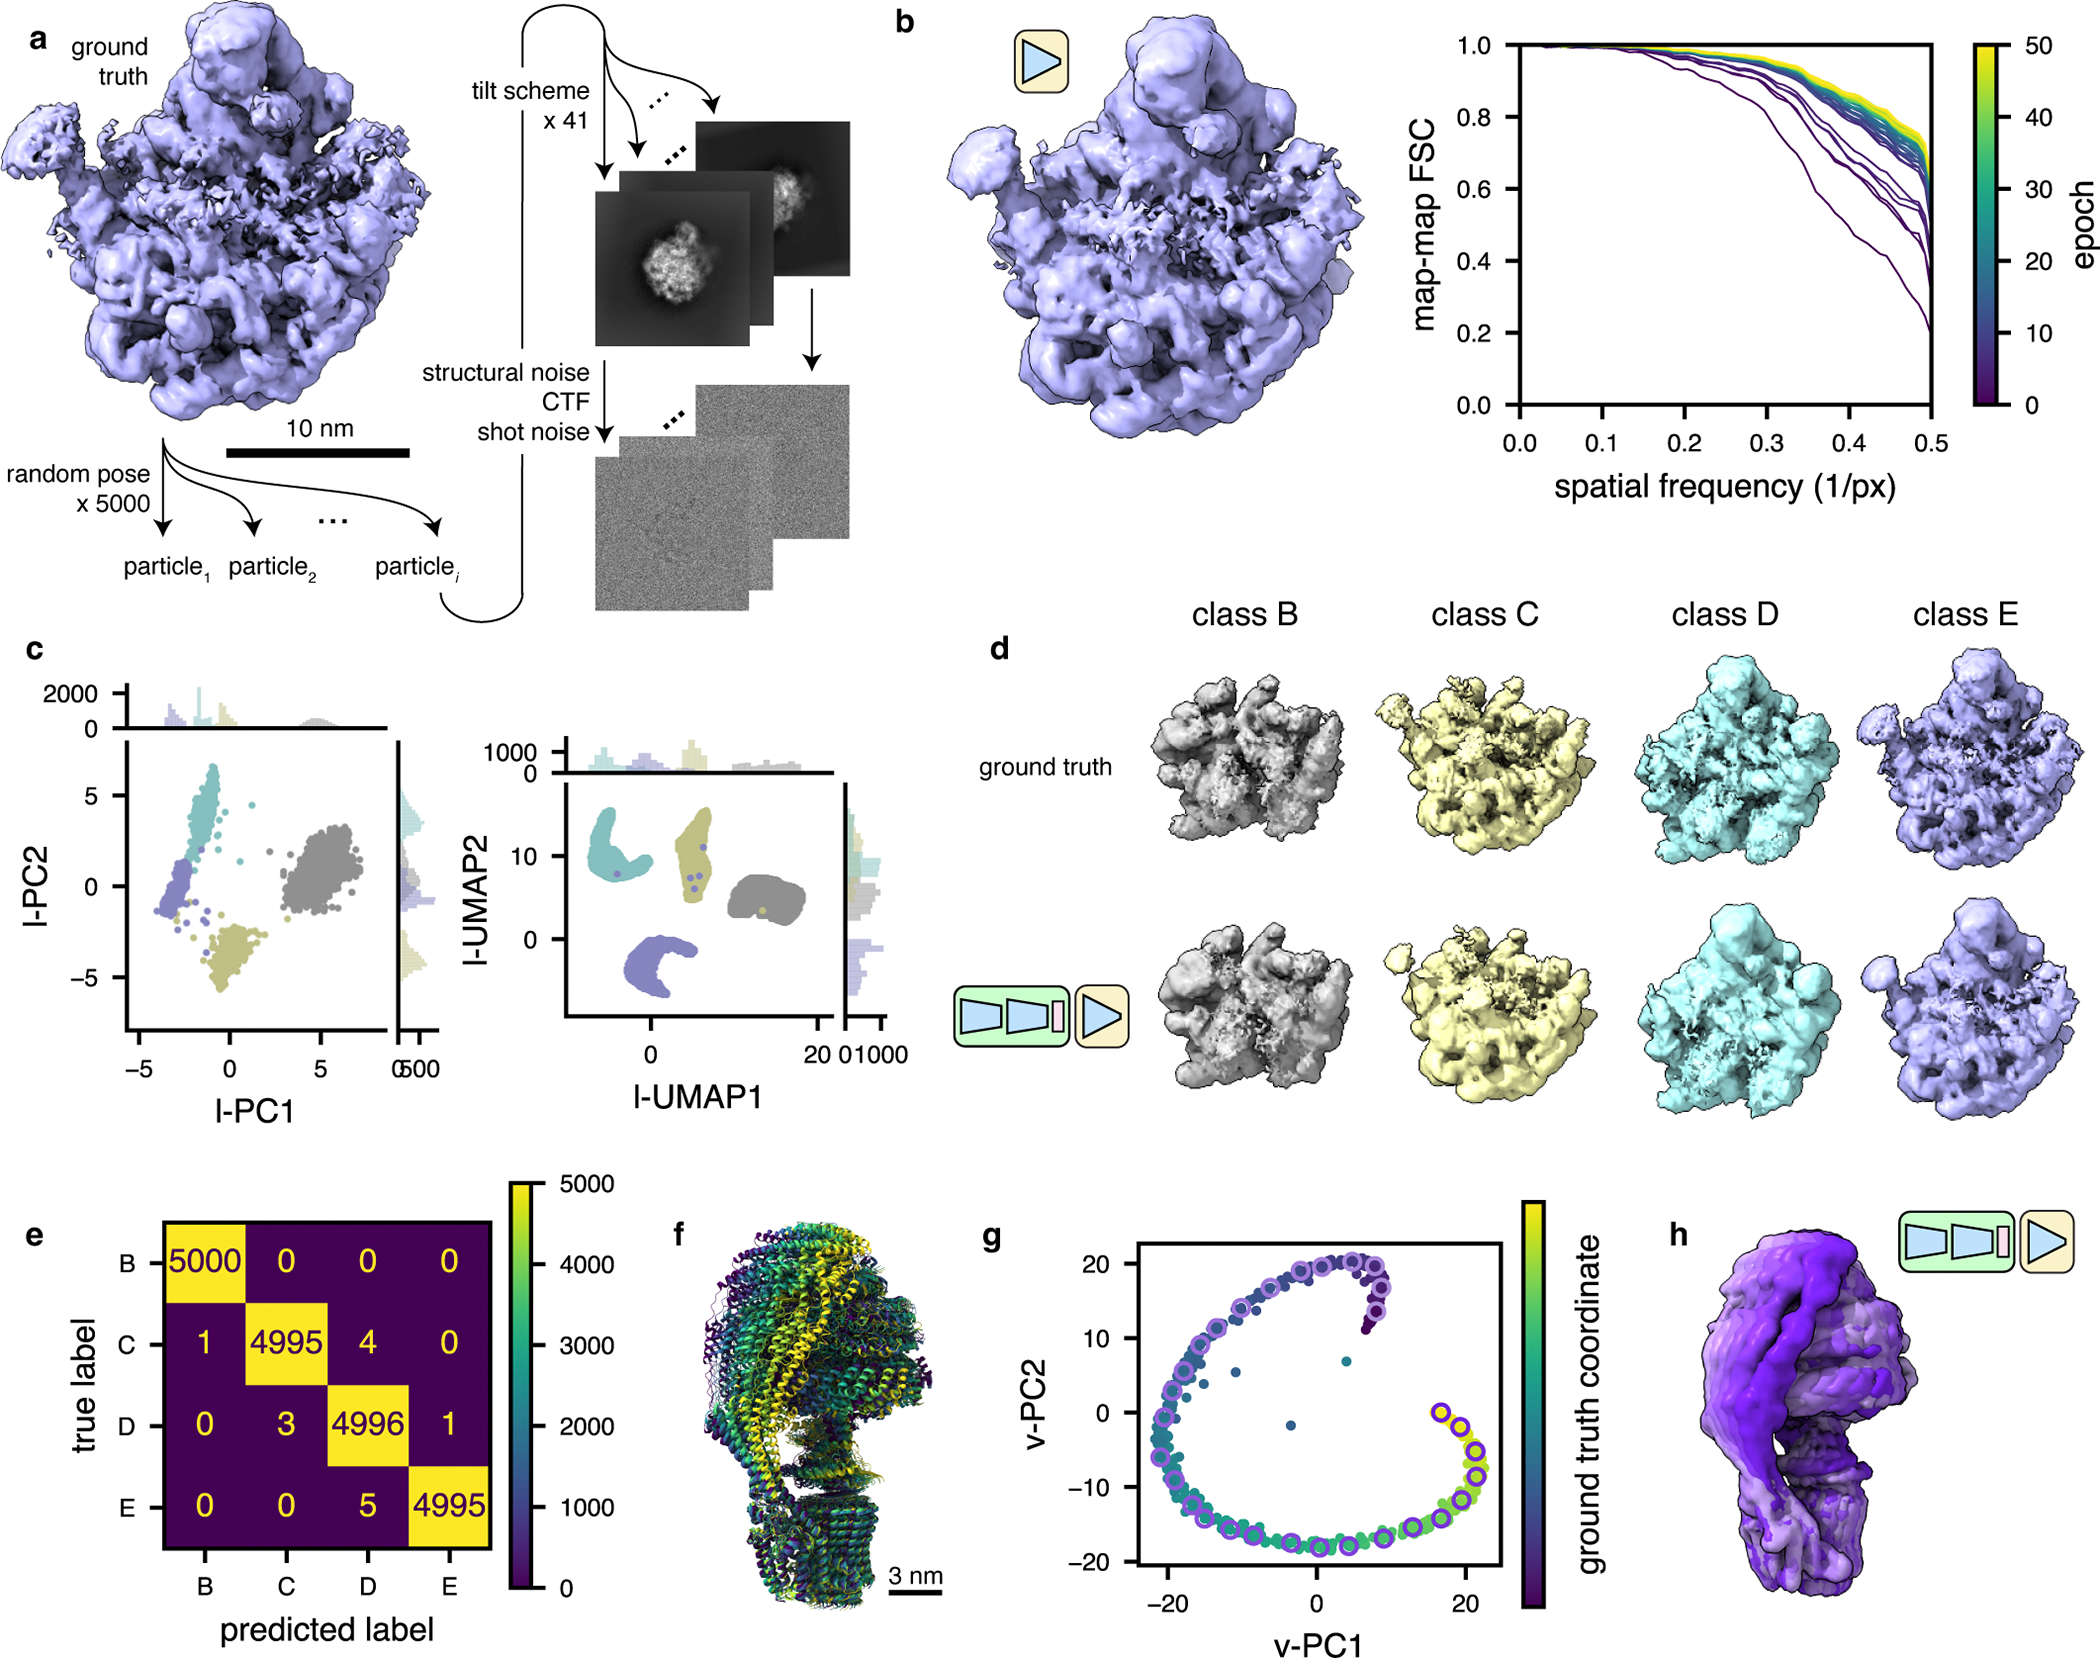
Figure 2: TomoDRGN recovers compositional and conformational heterogeneity in simulated datasets.

(a) Illustration of the method used to simulate tilt series particle stacks corresponding to four assembly states (B-E) of the bacterial large ribosomal subunit48.
(b) Left, a tomoDRGN homogeneous network reconstruction of the simulated class E dataset after 50 epochs of training using simulated images with a Nyquist resolution limit of 7.1 Å. Right, Fourier Shell Correlation between the tomoDRGN reconstruction and the ground truth volume at each of 50 epochs of training (purple to yellow).
(c) First two principal components (left) and UMAP embeddings (right) of tomoDRGN latent space when trained on the simulated four class dataset, colored by k=4 k-means classification of latent space.
(d) Ground truth ribosomal volumes (top) and corresponding tomoDRGN-reconstructed volumes (bottom) sampled from the median latent encoding of each of the k=4 k-means classes in (c).
(e) Confusion matrix of k-means clustering class labels from (c) against ground truth class labels.
(f) Superposition of yeast mitochondrial ATP synthase structures undergoing conformational changes during ATP hydrolysis50. Maps are colored purple to yellow along the simulated reaction coordinate.
(g) Voxel-based principal component analysis (vPCA)9 of 500 tomoDRGN-generated volumes sampled from a tomoDRGN model trained on the simulated ATP synthase dataset from panel (f). Points corresponding to each of the 500 tomoDRGN-generated volumes are colored according to their position along the simulated ground-truth reaction coordinate (see color scale). A subset of 30 such maps are sampled along the trajectory and outlined with a pink-to-purple color gradient, and these maps are presented in Supplementary Movie 1.
(h) Superposition of 6 tomoDRGN-generated volumes sampled down the continuous coordinate visualized in panel (g) and colored accordingly.
