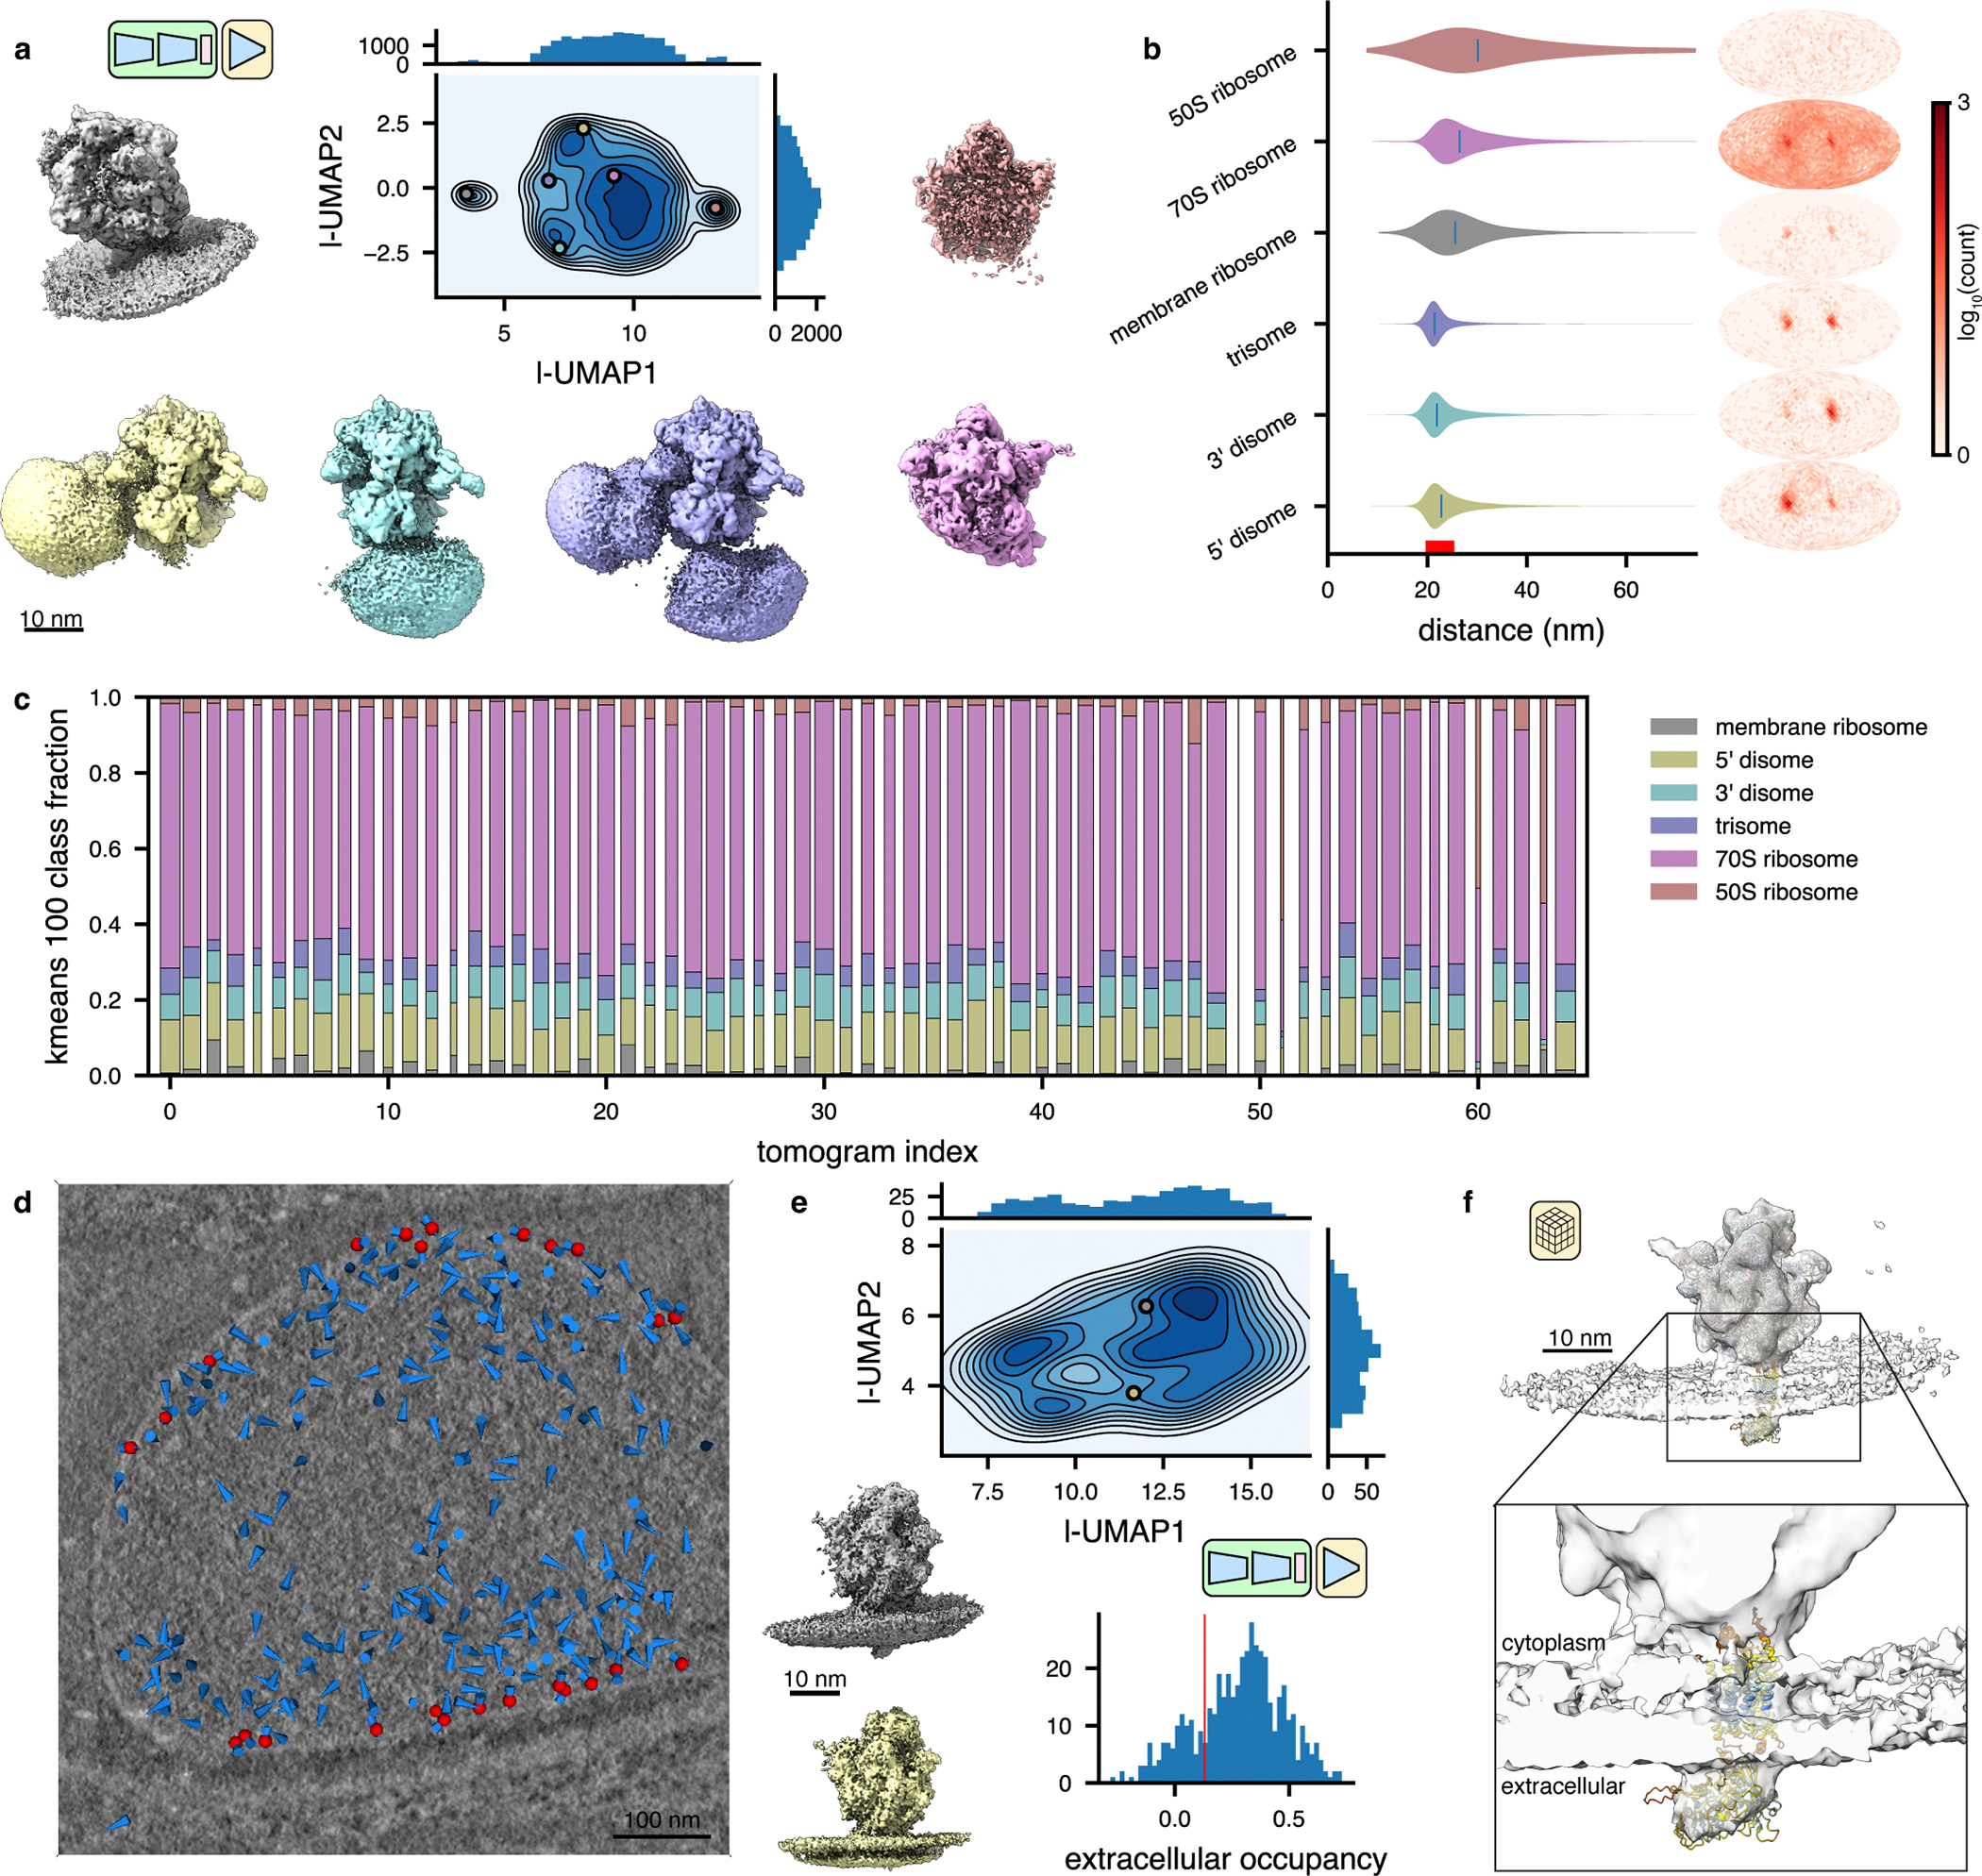
Figure 6: TomoDRGN captures intermolecular heterogeneity in situ.

(a) UMAP of tomoDRGN latent embeddings (n=20,981 particles re-extracted with box size ~3x particle radius). Colored volumes sampled from correspondingly colored points in UMAP are shown.
(b) Violin plot of the distance from each particle in the indicated classes from panel (a) to its nearest neighbor ribosome. The right bound of the x-axis corresponds to the box diameter, and the red interval on the x-axis corresponds to typical inter-ribosome distances in a prokaryotic polysome. Mollweide projection histograms for each class highlighted in panel (a), showing directions to each ribosome’s nearest neighbor ribosome, following rotation to the consensus pose.
(c) Distribution of primary structural classes per tomogram. Column width is proportional to each tomogram’s particle count. Within a column, the height of each color is proportional to the population of that structural class within that tomogram. Classes are colored as in (a).
(d) Screenshot from tomoDRGN’s interactive tomogram viewer showing all ribosomes for a single tomogram (blue cones) with ribosomes corresponding to membrane-associated classes further annotated as red spheres.
(e) UMAP of tomoDRGN latent embeddings (n=482) of membrane-associated ribosomes. Colored volumes are sampled from correspondingly colored points in latent space. Relative occupancy of globular extracellular density (n=482) is plotted as a histogram with a red line noting manually assigned threshold defining particles bearing the extracellular density (n=380).
(f) STA reconstruction of membrane-associated ribosomes bearing extracellular density identified by tomoDRGN with docked atomic model of Mycoplasma pneumoniae SecDF predicted using Alphafold (AF: A0A0H3DPH3).
