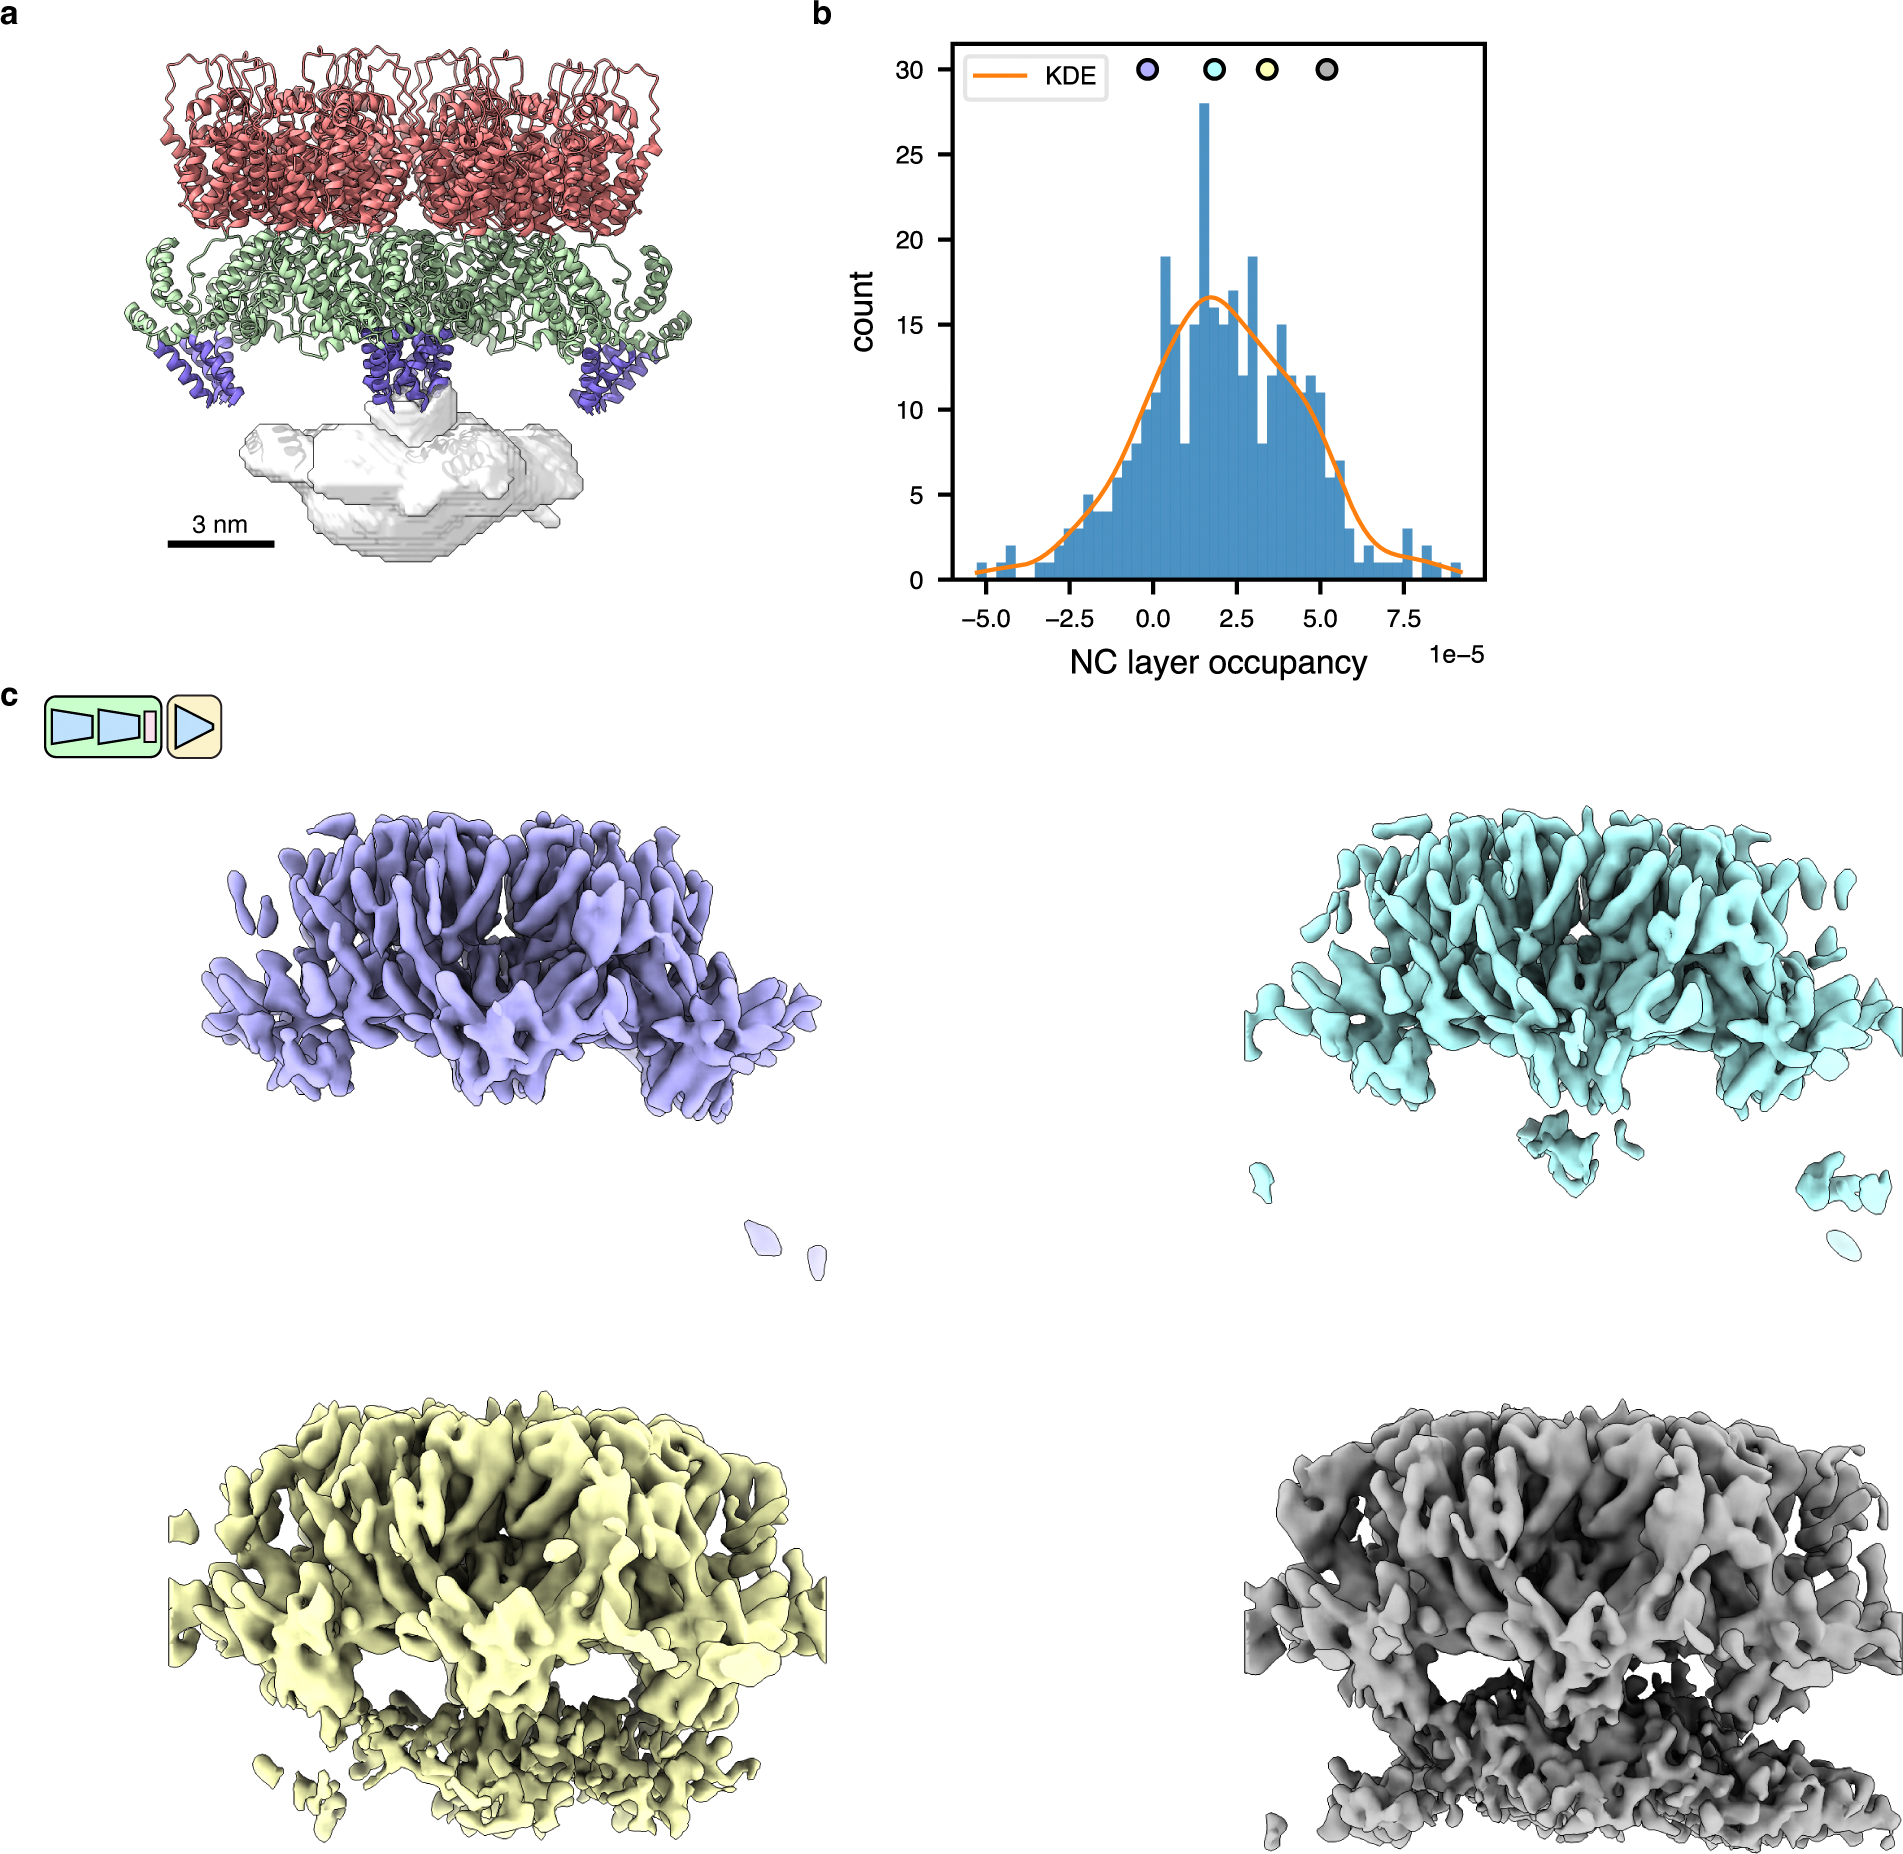
Extended Data Fig. 3. TomoDRGN and MAVEn identify structural variations within HIV Gag lattice.

(a) Mask used for MAVEn-based occupancy analysis of NC layer density (gray, translucent). PDB: 5L93 is shown for reference, with CA-NTD colored salmon, CA-CTD colored green, and CA-SP1 helix colored purple.
(b) Histogram and kernel density estimate of NC layer occupancy across 500 volumes sampled from the trained tomoDRGN model, excluding junk particles (see Fig 3g).
(c) Representative volumes sampling along the NC occupancy histogram, colored as indicated in (b). Volumes are rendered at constant isosurface and same pose as in (a).
