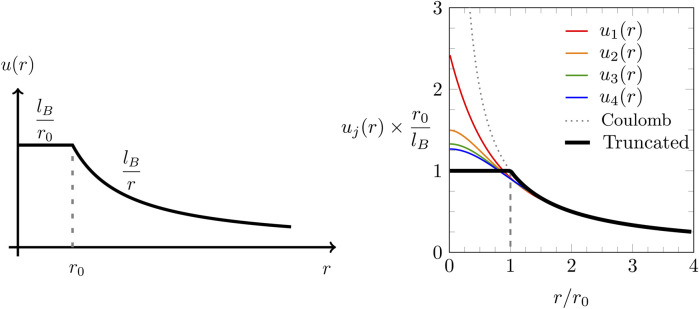
FIGURE 1.
Left diagram: plot of the truncated Coulomb potential as a function of the radial distance according to Equation 5. The truncation distance is , and the Bjerrum length is . Right diagram: truncated Coulomb potential (thick solid line) together with the increasingly more accurate approximations (first order, shown in red color), (second order, orange), (third order, green), and (fourth order, blue), as defined in Equation 8. The dotted line marks the Coulomb potential .

