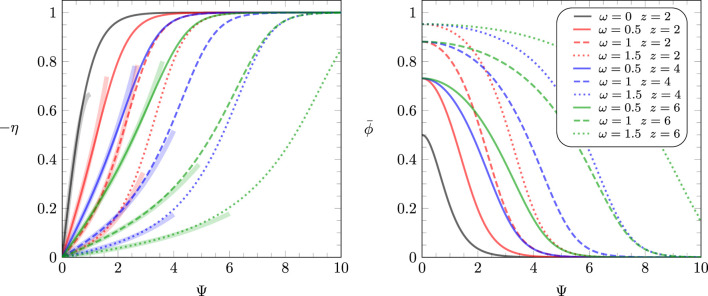
FIGURE 2.
Relationships (left diagram) and (right diagram) according to Equation 13. Curves of the same color refer to (red), (blue), and (green) and are calculated for (solid colored lines), (broken lines), and (dotted lines). For , Equation 13 predicts irrespective of (the black curve on the left diagram). All curves colored red follow the explicit expressions in Equation 15. The thick transparent lines in the left diagram represent third-order approximations of , as specified in Equations 29, 30. They will be utilized in Sections 3.1, 3.2 to calculate the differential capacitance for the linearized model and beyond that using a perturbation approach.

