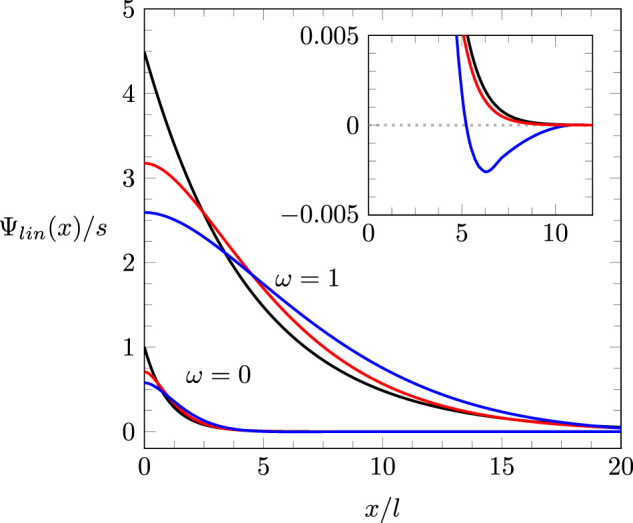
FIGURE 3.

for (upper three curves) and (lower three curves, magnified in the inset), with (black), (red), and (blue). All curves are calculated for . The black curves are single exponentials according to Equation 24 with a decay length for and for . The red curves are specified by Equation 25. The blue curves, which follow Equation 26, exhibit exponentially decaying oscillations.
