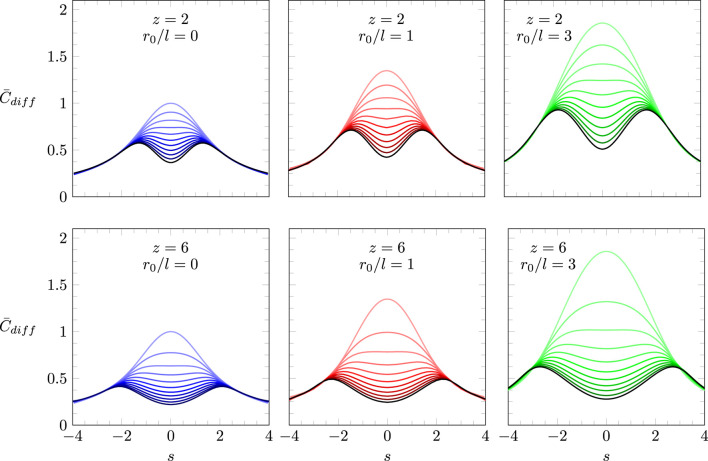
FIGURE 4.
Scaled differential capacitance as a function of the scaled surface charge density based on solving Equations 13, 16, 17. Each diagram shows 11 curves for (uppermost curve) to (black curve on the bottom), with changing in steps of 0.1. Diagrams refer to (upper three diagrams) and (lower three diagrams), as well as (left column, colored purple), (middle column, colored red), and (right column, colored green).

