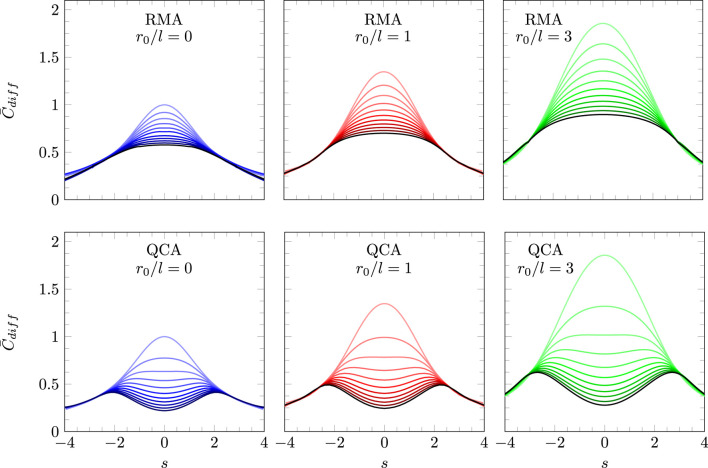
FIGURE 5.
Scaled differential capacitance as a function of the scaled surface charge density based on RMA (upper three diagrams) and QCA (lower three diagrams). The lower three diagrams of Figures 4, 5 are identical. Each diagram shows 11 curves for (uppermost curve) to (black curve on the bottom), with changing in steps of 0.1. Diagrams refer to (left column, colored purple), (middle column, colored red), and (right column, colored green). All curves are calculated for . All models are based on solving Equations 16, 17, yet with the relationship emerging from Equation 38 for the upper three diagrams and from Equation 13 for the lower three diagrams.

