Figure 3.
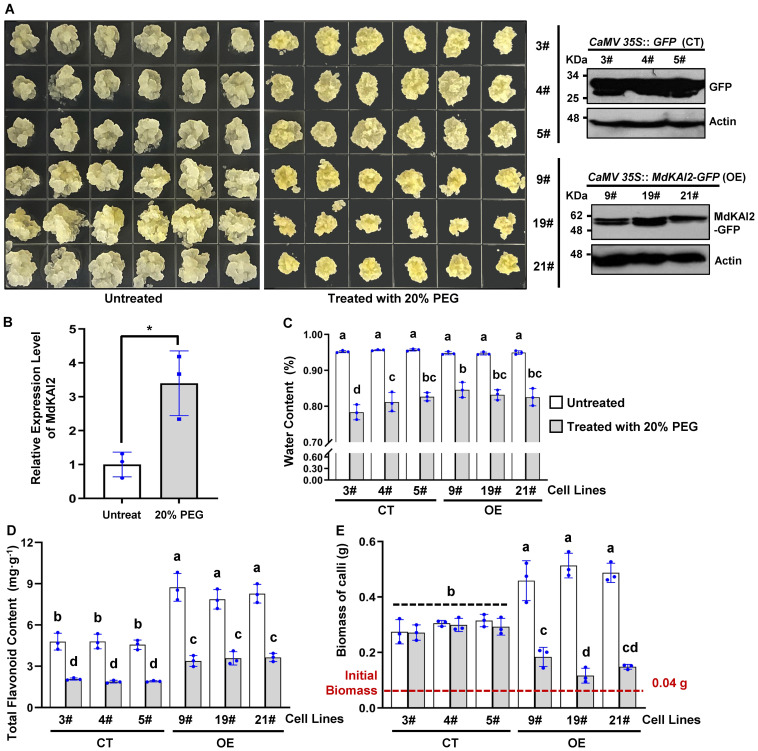
Phenotypic identification of the MdKAI2 gene in apple calli. Three MdKAI2−GFP−overexpressing callus lines (OE lines, marked #9, #19 and #21) and three GFP−overexpressing callus lines (CT lines, marked #3, #4 and #5) were obtained via transfection of Orin apple calli and verified via western blotting (A). Calli were inoculated in MS media vertically permeabilized with 20% PEG for 12 hours and subcultured in the dark at 24°C for 10 days to simulate osmotic stress. The control group without PEG stress was inoculated in MS media supplemented with the same volume of solvent, and the other operations were the same as those used for the stress group. Wild−type Orin apple calli treated with 20% PEG for 10 days were used for the detection of the MdKAI2 expression level (B). Phenotypes (A), fresh weight biomass (C), water content (D), and flavonoid content (E) of calli with or without PEG stress were evaluated. One−way ANOVA and multiple comparisons via Fisher’s LSD test were performed. The different characters at the top of the columns indicate significant differences (p<0.05). Student’s t test with paired and two−tailed distributions for pairwise comparisons was conducted, and asterisks indicate significant differences (*p<0.05). Three independent experiments were conducted, and the individual points for each biological replicate are marked in each column. The homoscedasticity and normal distribution of the data were confirmed by Levene’s test and the Shapiro−Wilk test, respectively.

