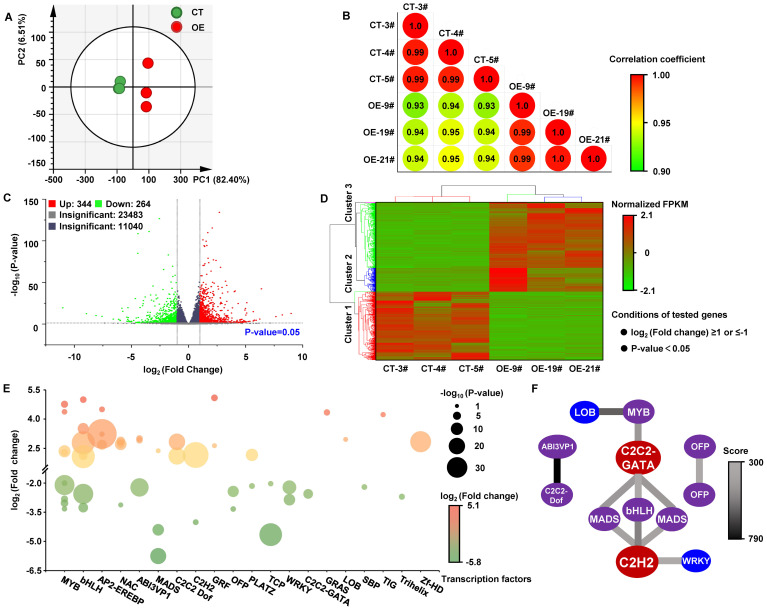
Figure 5.
RNA−Seq analysis and DEGs in MdKAI2−overexpressing apple calli. Total RNA from MdKAI2−GFP (OE)− and GFP (CT)−overexpressing calli was used for RNA−Seq. Three independent experiments were conducted. (A) PCA of the transcriptomes was performed on the basis of the expression level. (B) Correlation analysis of the transcriptomes was performed on the basis of the expression level, and the correlation between samples was calculated via the Spearman correlation coefficient. (C) Volcano plot of the number of DEGs. (D) Cluster heatmap of DEGs. Differential genes with a log2 (fold change) ≥1 or ≤-1 and a P value<0.05 were used for cluster analysis. The fold change represents the gene FPKM value ratio of the OE and CT groups. The fragments per kilobase of transcript per million mapped reads (FPKM) values were standardized via the z score method to construct a cluster heatmap. (E) Analysis of differentially expressed annotated TFs according to the TF protein domain via the PlantTFDB (Plant Transcription Factor Database). Red and green represent up− and downregulated TFs, respectively, after overexpressing MdKAI2. The color depth represents the difference multiple, and the circle size represents the size of the P value. (F) Interaction network prediction of TFs. Using the BGI online program, the TFs were aligned to the STRING database, and the interactions between genes were obtained according to their homology with known proteins. The color of the line segment indicates the interaction score. The darker the color is, the more reliable the interaction.

