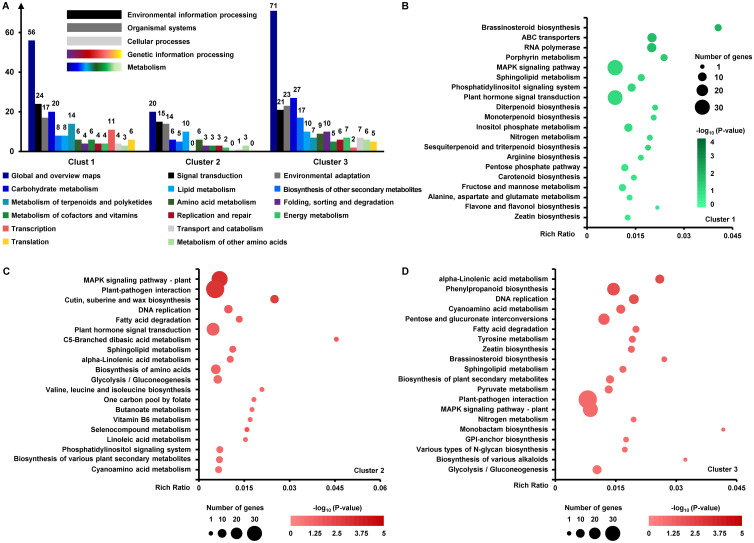
Figure 6.
KEGG enrichment and classification analyses of DEGs. According to the results of the cluster analysis of the DEGs, KEGG classification analysis (A) was conducted on the up− and downregulated genes. The classification of gene clusters for which the sum of genes annotated to each classification was greater than ten was selected for statistical graphing. The color of the column indicates the different categories of the KEGG classifications, and the numbers on each column indicate the number of DEGs annotated to each classification in the gene cluster. KEGG enrichment analyses were conducted on the basis of one cluster of downregulated (B) and two clusters of upregulated (C, D) DEGs. The top 20 terms with low P values of enriched genes were selected for mapping. The rich ratio represents the ratio of the number of term candidate genes to the number of term genes. DEGs with log2 (fold change) values ≥1 or ≤-1 and a P value < 0.05 were utilized for analyses, and the fold change represents the ratio of the FPKM values of the OE and CT genes. The analyses above were conducted via OmicShare online programs.

