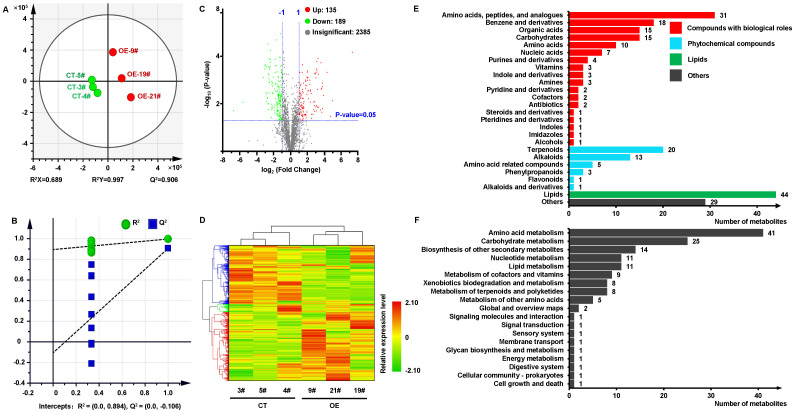
Figure 7.
Metabolomic analysis of apple calli overexpressing MdKAI2. A total of 2709 metabolites were subjected to PLS−DA analysis (A), and 200 permutation tests were performed to verify the R−squared value and predictive ability of the model (B). The distributions of the up− and downregulated metabolites were analyzed (C), and cluster analysis was performed on the basis of the relative abundance of the differentially expressed metabolites within the Pearson correlation coefficient (DEM), the metabolite abundance in each row was normalized via the z score method, and the average linkage method was used for clustering (D). KEGG classification analysis (E) and pathway analysis (F) were conducted on all annotated metabolites via the OmicShare online program. Different colors represent different metabolite classification entries, and the numbers indicate the number of annotated metabolites in the final classification.

