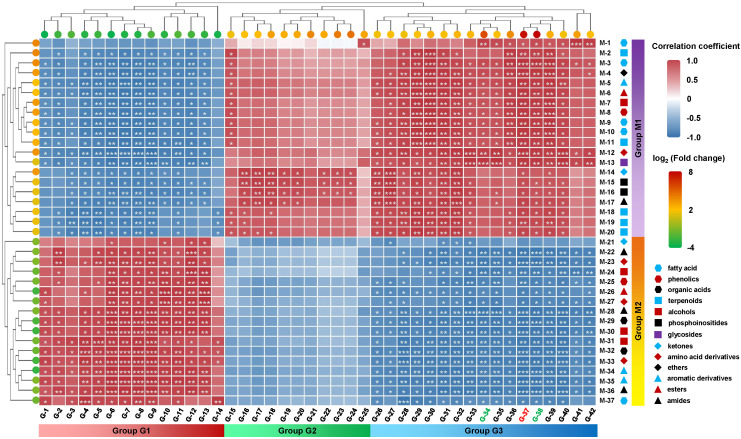
Figure 8.
Correlation analysis of DEMs with MdKAI2 and MAPK signaling pathway genes. Thirty−seven annotated DEMs (log2 (fold change) ≥ 1 or ≤ -1, P value <0.05, and VIP >1) were selected. A total of 42 DEGs (log2 (fold change) ≥ 2 or ≤ -2, P value <0.05), including genes related to the MdKAI2 and MAPK signaling pathways, were also selected for correlation cluster analysis on the basis of their expression levels. The Pearson correlation coefficient was used to reflect the correlation. The color of the square color block indicates the correlation level, and the red and blue colors indicate positive and negative correlations, respectively. The asterisk indicates a correlation (*P< 0.05, **P < 0.01, ***P < 0.001). The circles on the left and above indicate the changes in the expression levels of genes and metabolites after the overexpression of MdKAI2. Red and green indicate up− and downregulation, respectively. The different colors and shapes of the icons below indicate the metabolite type. The code numbers on the right and below indicate the corresponding DEGs and DEMs, respectively.

