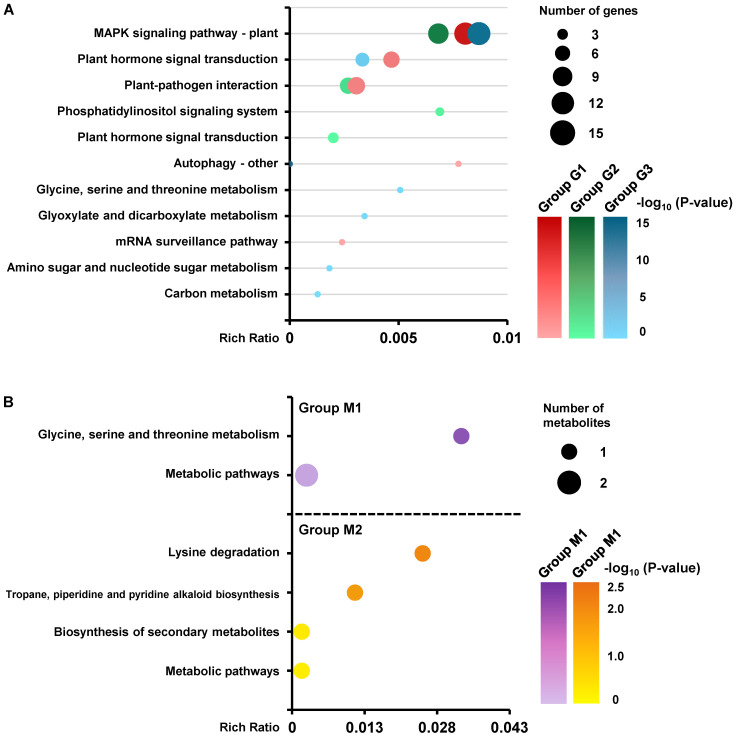
Figure 9.
KEGG enrichment analyses of DEGs and DEMs. Two differentially expressed MdCDPKs, 39 differentially expressed MAPK signaling−related DEGs, and MdKAI2, whose expression levels were log2 (fold change) ≥ 2 or ≤ -2 and whose P value was <0.05, were used for KEGG enrichment analyses (A). Thirty−seven annotated DEMs whose expression levels were log2 (fold change) ≥ 1 or ≤ -1, P value <0.05, and VIP >1 were used for KEGG enrichment analyses (B). The order is sorted by P value from low to high. Different colors represent different groups of DEGs and DEMs, and the color shading indicates the P value. The sizes of the circles represent the number of DEGs and DEMs belonging to each corresponding pathway.

