Figure 1.
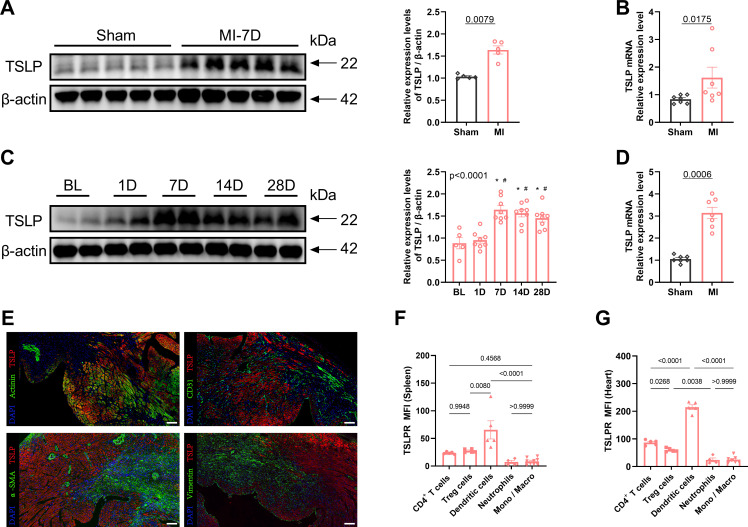
Thymic stromal lymphopoietin (TSLP) levels are elevated in cardiac tissues following myocardial infarction (MI). (A) MI was induced in C57/B6J mice in vivo and western blotting analysis of TSLP expression in heart tissues was performed on day 7 later, using β-actin as a loading control; each lane represents an independent mouse heart (n = 5 per group). (B) Tlsp mRNA levels in the heart tissues of mice on day 7 post-MI. Transcripts were normalized to glyceraldehyde-3-phosphate dehydrogenase (Gapdh) (n = 7 per group). (C) A representative western blotting analysis was conducted to assess TSLP expression in mouse cardiac tissues at baseline (BL) and day 1, day 7, day 14, and day 28 post-MI (n =5–8 per group). (D) Tslp mRNA expression was evaluated in myocardial cells isolated using the Langendorff perfusion system from mice in both the MI and sham groups on day 7 post-surgery (n = 7 per group). (E) TSLP representative immunofluorescence staining in myocardial tissues of mice on day 7 post-MI: TSLP (red), α-actinin (green, upper left images), CD31 (green, upper right images), alpha smooth muscle actin (α-SMA; green, bottom left images), and vimentin (green, bottom right images). The sections were counterstained with 4’,6-diamidino-2-phenylindole (DAPI) to visualize nuclei (blue; scale bar: 50 μm) (n = 5 per group). (F, G) Surface expression of TSLP receptor (TSLPR) on CD4+ T cells, T regulatory (Treg) cells, dendritic cells, neutrophils and monocytes/macrophages (Mono/Macro) in the spleen and heart on day 7 post-MI (n = 4–9 per group). Mann–Whitney U test was used to analyze the data in (A, B, D), whereas the data in (C, F, G) were analyzed using one-way ANOVA, followed by Tukey’s multiple comparisons test. *P< 0.05 compared with BL; #P< 0.05 compared with 1D.

